If you’ve ever wondered whether your project is truly on track, beyond just looking at completed tasks or checking your bank balance, Earned Value Management (EVM) is the answer you’ve been searching for.
EVM is widely regarded as one of the most powerful project control techniques in modern project management. It’s a foundational component of the Project Management Body of Knowledge (PMBOK® Guide) and a critical competency for PMP® certification candidates.
But here’s the thing: while EVM formulas might look intimidating at first glance, they’re actually quite intuitive once you understand the underlying logic. More importantly, they provide objective, data-driven insights into project performance that gut feelings and status reports simply can’t match.
In this comprehensive guide, we’ll demystify Earned Value Management by explaining:
- What EVM is and why it matters
- The core EVM formulas with practical examples
- How to interpret EVM metrics
- Real-world applications and case studies
- Best practices for implementing EVM in 2026
Whether you’re a project manager preparing for the PMP exam, a PMO leader implementing performance tracking systems, or a stakeholder who wants to understand project health reports, this guide will equip you with the knowledge you need.
What is Earned Value Management (EVM)?
Earned Value Management (EVM) is a project management methodology that integrates scope, schedule, and cost to objectively measure project performance. Unlike traditional project tracking that looks at time and budget separately, EVM provides a unified view of project health by comparing:
- What you planned to accomplish (Planned Value)
- What you actually accomplished (Earned Value)
- What you actually spent (Actual Cost)
According to the PMI’s Earned Value Management practice standard, EVM is used to:
- Measure current project performance
- Forecast future project outcomes
- Improve project performance through data-driven decision-making
Why Earned Value Management (EVM) Matters
EVM addresses a fundamental challenge in project management: knowing where you truly stand. Consider these common scenarios:
Scenario 1: Your project is 50% complete, and you’ve spent 50% of the budget. Sounds good, right? Not necessarily. If you were supposed to be 70% complete by now, you’re actually 20% behind schedule, a critical issue hidden by surface-level metrics.
Scenario 2: Your team reports they’re 80% done, but upon inspection, only 60% of deliverables meet acceptance criteria. Your earned value is actually 60%, not 80%, meaning you’re behind schedule and potentially over budget.
With EVM: You have objective data showing exactly how much value you’ve delivered relative to time and cost, enabling proactive corrective action rather than reactive crisis management.
The Foundation: Three Core Earned Value Management (EVM) Inputs
Before diving into formulas, you need to understand the three fundamental inputs that power all EVM calculations: 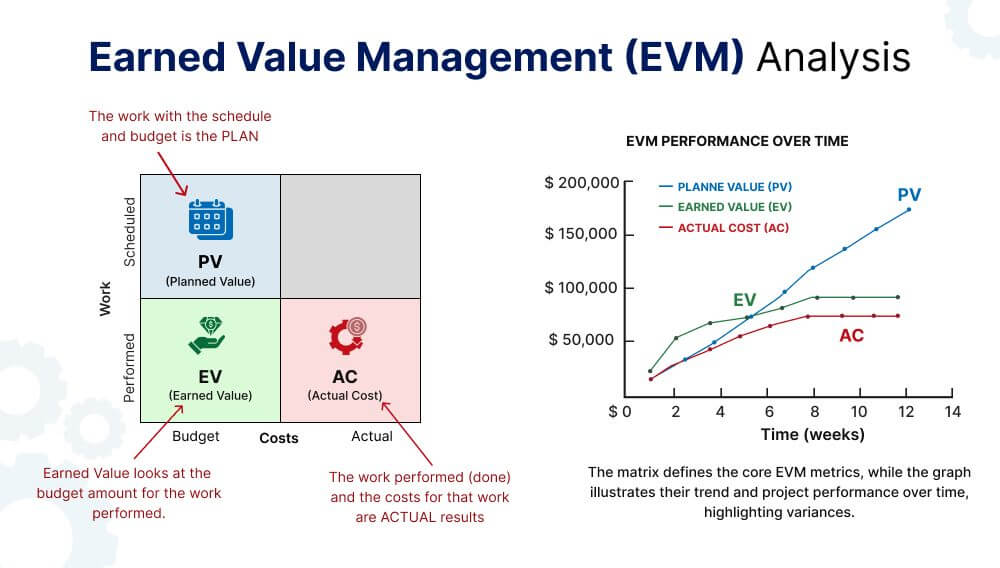
1. Planned Value (PV)
Definition: The authorized, time-phased budget for scheduled work up to the status date. Also known as the Budgeted Cost of Work Scheduled (BCWS).
In Simple Terms: What you planned to spend on work that should be complete by now.
Example: You’re building a website with a total budget of $30,000 over 10 weeks. By week 5, according to your schedule, you should have completed $15,000 worth of work. Therefore, your PV at week 5 = $15,000.
2. Earned Value (EV)
Definition: The value of work actually completed, measured in budget terms. Also known as the Budgeted Cost of Work Performed (BCWP).
In Simple Terms: The budget value of the work you’ve actually completed.
Example: Continuing the website example, by week 5, you’ve actually completed only 40% of the total work scope. The work you’ve completed has a budget value of 40% × $30,000 = $12,000. Therefore, your EV at week 5 = $12,000.
Key Point: EV is based on the budget value of completed work, NOT the actual money spent.
3. Actual Cost (AC)
Definition: The actual cost incurred for work performed up to the status date. Also known as the Actual Cost of Work Performed (ACWP).
In Simple Terms: What you’ve actually spent so far.
Example: By week 5, you’ve paid developers, designers, and purchased hosting services totaling $14,000. Therefore, your AC at week 5 = $14,000.
4. Budget at Completion (BAC)
Definition: The total planned budget for the entire project.
Example: For our website project, BAC = $30,000.
Current Status: Earned Value Management (EVM) Performance Metrics
Now that we have our three core inputs (PV, EV, AC), we can calculate metrics that answer two critical questions:
- Schedule Performance: Are we ahead or behind schedule?
- Cost Performance: Are we over or under budget?
Schedule Variance (SV)
Formula:
SV = EV – PV
Interpretation:
- SV > 0: Project is ahead of schedule
- SV = 0: Project is on schedule
- SV < 0: Project is behind schedule
Example (using our website project):
SV = $12,000 (EV) – $15,000 (PV) = -$3,000
Interpretation: The project is $3,000 worth of work behind schedule. You’ve completed less work than planned by this point.
Schedule Performance Index (SPI)
Formula:
SPI = EV / PV
Interpretation:
- SPI > 1.0: Project is ahead of schedule (earning more value than planned)
- SPI = 1.0: Project is on schedule
- SPI < 1.0: Project is behind schedule
Example:
SPI = $12,000 / $15,000 = 0.80
Interpretation: For every dollar of planned work, you’re only completing $0.80 worth. You’re operating at 80% efficiency, meaning you’re 20% behind schedule.
Key Insight: SPI tells you the rate of progress. An SPI of 0.80 means you’re progressing at 80% of the planned rate.
Cost Variance (CV)
Formula:
CV = EV – AC
Interpretation:
- CV > 0: Project is under budget
- CV = 0: Project is on budget
- CV < 0: Project is over budget
Example:
CV = $12,000 (EV) – $14,000 (AC) = -$2,000
Interpretation: The project is $2,000 over budget for the work completed. You’ve spent more than the budgeted value of the work you’ve done.
Cost Performance Index (CPI)
Formula:
CPI = EV / AC
Interpretation:
- CPI > 1.0: Project is under budget (getting more value per dollar)
- CPI = 1.0: Project is on budget
- CPI < 1.0: Project is over budget
Example:
CPI = $12,000 / $14,000 = 0.86
Interpretation: For every dollar spent, you’re earning $0.86 worth of value. Your cost efficiency is 86%, meaning you’re 14% over budget relative to work completed.
Critical Note: According to PMI research, CPI tends to stabilize after 20% of the project is complete and rarely improves significantly thereafter. If your CPI is poor early on, expect it to remain poor unless major corrective action is taken.
Forecasting: Predicting Project Outcomes
The real power of EVM lies in its ability to forecast future performance based on current trends. Here are the key forecasting formulas:
Estimate at Completion (EAC)
Definition: The projected total cost of the project at completion.
EAC has four different formulas, each based on different assumptions about future performance:
EAC Method 1: Atypical Variance
Formula:
EAC = AC + (BAC – EV)
When to Use: Current cost variance is atypical (one-time issue), and future work will proceed as originally planned.
Example:
EAC = $14,000 + ($30,000 – $12,000) = $32,000
EAC Method 2: Typical CPI Variance
Formula:
EAC = BAC / CPI
When to Use: Current cost performance is typical and will continue for the remainder of the project. Most commonly used method.
Example:
EAC = $30,000 / 0.86 = $34,884
Interpretation: If current cost trends continue, the project will cost approximately $34,884 at completion, nearly $5,000 over budget.
EAC Method 3: Combined CPI and SPI Impact
Formula:
EAC = AC + [(BAC – EV) / (CPI × SPI)]
When to Use: Both cost and schedule performance will affect future work. Recommended by many practitioners as it accounts for both factors.
Example:
EAC = $14,000 + [($30,000 – $12,000) / (0.86 × 0.80)]
= $14,000 + ($18,000 / 0.688)
= $14,000 + $26,163
= $40,163
Interpretation: When considering both cost and schedule inefficiencies, the project is forecasted to cost approximately $40,163, significantly over budget.
EAC Method 4: Bottom-Up Re-Estimate
Formula:
EAC = AC + Bottom-up ETC
When to Use: The original plan is no longer valid; it requires creating a completely new estimate for the remaining work.
Estimate to Complete (ETC)
Definition: The projected cost to complete all remaining work.
Formula (most common):
ETC = EAC – AC
Example (using EAC Method 2):
ETC = $34,884 – $14,000 = $20,884
Interpretation: You need approximately $20,884 more to complete the project (assuming current trends continue).
Variance at Completion (VAC)
Definition: The projected budget surplus or deficit at project completion.
Formula:
VAC = BAC – EAC
Example:
VAC = $30,000 – $34,884 = -$4,884
Interpretation: The project is forecasted to finish approximately $4,884 over budget.
- VAC > 0: Project will finish under budget
- VAC = 0: Project will finish on budget
- VAC < 0: Project will finish over budget
To-Complete Performance Index (TCPI)
Definition: The cost performance efficiency required to complete the project within budget.
Formula (to meet BAC):
TCPI = (BAC – EV) / (BAC – AC)
Example:
TCPI = ($30,000 – $12,000) / ($30,000 – $14,000)
= $18,000 / $16,000
= 1.125
Interpretation: To finish the project on the original budget (BAC), you must achieve a CPI of 1.125 for all remaining work. Since your current CPI is only 0.86, this represents a 31% improvement in cost efficiency, a significant challenge.
Alternative Formula (to meet revised EAC):
TCPI = (BAC – EV) / (EAC – AC)
Interpretation Guidelines:
- TCPI > 1.0: Remaining work must be more efficient than originally planned
- TCPI = 1.0: Remaining work must match the original plan’s efficiency
- TCPI < 1.0: Remaining work can be less efficient than originally planned
Real-World Application: If your TCPI is 1.5 or higher, it indicates very poor performance to date and signals that meeting the original budget is highly unlikely without major interventions.
Complete EVM Example: Website Redesign Project
Let’s walk through a comprehensive example to tie everything together.
Project Overview
- Project: Corporate website redesign
- Budget at Completion (BAC): $50,000
- Project Duration: 10 weeks
- Current Status Date: End of Week 6
Data Collection (Week 6)
| Metric | Value | Explanation |
| BAC | $50,000 | Total project budget |
| PV | $30,000 | According to the schedule, 60% of the work ($50,000 × 60%) should be complete |
| EV | $22,500 | Actually completed 45% of work ($50,000 × 45%) |
| AC | $28,000 | Actual costs incurred to date |
Current Performance Calculations
Schedule Performance
SV = EV – PV = $22,500 – $30,000 = -$7,500
SPI = EV / PV = $22,500 / $30,000 = 0.75
Status: Project is $7,500 worth of work behind schedule, operating at 75% schedule efficiency (25% behind).
Cost Performance
CV = EV – AC = $22,500 – $28,000 = -$5,500
CPI = EV / AC = $22,500 / $28,000 = 0.80
Status: Project is $5,500 over budget, with only $0.80 of value earned for every dollar spent (20% over budget).
Forecast Calculations
Estimate at Completion (using CPI method)
EAC = BAC / CPI = $50,000 / 0.80 = $62,500
Forecast: Project will cost $62,500 if current trends continue, $12,500 over budget.
Estimate to Complete
ETC = EAC – AC = $62,500 – $28,000 = $34,500
Forecast: Need $34,500 more to complete the project.
Variance at Completion
VAC = BAC – EAC = $50,000 – $62,500 = -$12,500
Forecast: Project will finish $12,500 over budget.
To-Complete Performance Index
TCPI = (BAC – EV) / (BAC – AC)
= ($50,000 – $22,500) / ($50,000 – $28,000)
= $27,500 / $22,000
= 1.25
Requirement: To finish on original budget, remaining work must achieve a CPI of 1.25—a 56% improvement over current performance (0.80).
Executive Summary
| Health Indicator | Status | Value | Assessment |
| Schedule | Behind | SPI = 0.75 | 25% behind schedule |
| Cost | Over Budget | CPI = 0.80 | 20% over budget |
| Completion Forecast | Over Budget | EAC = $62,500 | $12,500 (25%) over budget |
| Recovery Difficulty | Challenging | TCPI = 1.25 | Requires 56% efficiency improvement |
Recommended Actions:
- Investigate root causes of cost and schedule overruns.
- Re-evaluate the remaining scope for potential reductions.
- Consider adding resources to improve schedule performance.
- Implement stricter cost controls.
- Escalate to stakeholders for additional budget or scope adjustments.
Interpreting Earned Value Management (EVM) Results: Quick Reference Guide
Performance Index Interpretation
| Index Value | CPI Meaning | SPI Meaning | Status |
| > 1.2 | Excellent cost efficiency | Significantly ahead of schedule | Excellent |
| 1.0 – 1.2 | Good performance | On or ahead of schedule | On Track |
| 0.95 – 1.0 | Acceptable (minor variance) | Slightly behind schedule | Watch |
| 0.8 – 0.95 | Concerning | Notably behind schedule | At Risk |
| < 0.8 | Serious issues | Critically behind | Critical |
Common Earned Value Management (EVM) Scenarios
| CPI | SPI | Diagnosis | Action Priority |
| < 1.0 | < 1.0 | Over budget AND behind schedule | URGENT: Immediate corrective action |
| < 1.0 | > 1.0 | Over budget BUT ahead of schedule | Review costs; may be accelerating unnecessarily |
| > 1.0 | < 1.0 | Under budget BUT behind schedule | May indicate resource constraints; add resources |
| > 1.0 | > 1.0 | Under budget AND ahead of schedule | Excellent: Monitor to maintain performance |
Real-World Earned Value Management (EVM) Application: Construction Case Study
Wind Power Plant Construction Project
Project Details:
- Project: 50 MW wind farm construction
- BAC: $500,000
- Planned Duration: 10 months
- Status Point: End of Month 5
Month 5 Data:
- PV: $250,000 (50% of budget should be spent by month 5)
- EV: $275,000 (55% of work actually completed)
- AC: $265,000 (Actual expenditure)
Performance Analysis:
SPI = $275,000 / $250,000 = 1.10
CPI = $275,000 / $265,000 = 1.04
Interpretation:
- Schedule: Ahead by 10% (SPI = 1.10)
- Cost: Under budget by 4% (CPI = 1.04)
Forecast:
EAC = BAC / CPI = $500,000 / 1.04 = $480,769
VAC = $500,000 – $480,769 = $19,231
Outcome: Project is forecasted to complete $19,231 under budget, excellent performance!
Key Success Factors (according to project retrospective):
- Detailed baseline planning with accurate work packages.
- Weekly EVM reporting to management.
- Early identification of turbine delivery risks (using SPI trends).
- Proactive mitigation prevented schedule slippage.
Earned Value Management (EVM) Software Tools for 2026
Manual EVM calculations work for small projects, but enterprise projects require automated tools. Here are the leading EVM software platforms in 2026:
1. Microsoft Project
Best For: Small to mid-sized projects; organizations already using Microsoft 365
EVM Features:
- Built-in EVM calculations and reports
- Baseline management for PV tracking
- Earned value tables and visual dashboards
- Integration with Excel for custom reporting
Limitations: Less robust for large, complex programs
Pricing: Starts at $10/user/month (Project Plan 1)
2. Oracle Primavera P6
Best For: Large-scale construction, engineering, and infrastructure projects
EVM Features:
- Advanced baseline management (multiple baselines)
- Comprehensive earned value reports
- Resource-loaded scheduling for accurate PV
- Integration with cost management systems
- ANSI-748 EVMS compliance
Strengths: Industry standard for complex projects; superior scheduling capabilities
Pricing: Enterprise licensing; typically $1,500-$3,000+ per user
3. Deltek Cobra
Best For: Government contractors requiring EVMS compliance
EVM Features:
- Dedicated EVMS software (not just a feature)
- Full ANSI-748 compliance
- Integration with Primavera P6 and MS Project
- Comprehensive forecasting models
- Government reporting formats (IPMR, IPMDAR)
Pricing: Enterprise licensing
4. EcoSys (Hexagon)
Best For: Portfolio-level EVM across multiple projects
EVM Features:
- Enterprise Project Performance (EPP) platform
- Portfolio-level earned value aggregation
- Integration with Oracle, SAP, and other ERPs
- Real-time dashboards and analytics
Pricing: Enterprise licensing; contact for a quote
5. BigTime
Best For: Professional services firms (consulting, agencies)
EVM Features:
- Simplified EVM for service projects
- Time tracking integration for actual costs
- Budget vs. actual reporting
- Client-facing earned value reports
Pricing: Starts at $10/user/month
Earned Value Management (EVM) Implementation Best Practices
1. Establish a Solid Baseline
Do:
- Create a detailed Work Breakdown Structure (WBS)
- Assign budgets to all work packages
- Ensure schedule has realistic durations
- Get stakeholder approval before baselining
Don’t:
- Start without a complete, resource-loaded schedule
- Baseline before the scope is finalized
- Skip WBS creation (EVM requires work packages)
2. Measure Progress Accurately
Physical Percent Complete Methods:
- 0/100 Rule: No credit until the task is 100% complete (conservative).
- 50/50 Rule: 50% credit at start, 50% at completion (simple).
- 25/75 Rule: 25% at start, 75% at completion (balanced).
- Weighted Milestones: Credit based on milestone achievement (accurate).
- Percent Complete Estimates: Subjective assessment (requires discipline).
Best Practice: Use weighted milestones or the 0/100 rule for short-duration tasks (<2 weeks) to minimize subjectivity.
3. Report Consistently
Frequency: Weekly for most projects; daily for critical, fast-moving projects
Audience-Specific Reports:
- Executive: CPI, SPI, EAC, VAC (high-level dashboard)
- Project Manager: Full EVM metrics plus variance analysis
- Team Leads: Work package-level EV for their areas
4. Focus on Trends, Not Just Snapshots
Single-period EVM data can be misleading. Track CPI and SPI trends over time using trend charts:
- CPI stabilizing below 1.0: Systemic cost issues
- SPI declining over time: Schedule slippage accelerating
- TCPI increasing: Recovery becoming less feasible
5. Use EVM for Decisions, Not Just Reporting
EVM should drive action:
- CPI < 0.95 for 3 consecutive periods: Trigger cost recovery plan
- SPI < 0.90: Add resources or reduce scope
- TCPI > 1.2: Escalate to stakeholders for budget increase or scope reduction
6. Avoid Common Pitfalls
Pitfall 1: “We’re 80% complete” based on time elapsed, not work done.
Solution: Measure EV based on deliverable completion, not calendar time.
Pitfall 2: Ignoring quality issues when calculating EV.
Solution: Only credit EV for work that meets acceptance criteria.
Pitfall 3: Using EVM on projects without clear deliverables (e.g., R&D).
Solution: EVM works best for projects with tangible, measurable outputs.
Conclusion:
Earned Value Management is more than a set of formulas; it is a disciplined way of seeing project reality. By integrating scope, schedule, and cost into a single view, EVM replaces “green” status reports and gut feel with objective indicators of health, variance, and likely outcomes. When you track PV, EV, AC, and use CPI, SPI, EAC, and TCPI consistently, you move from reacting to overruns late to spotting trends early enough to correct course.
The real benefit shows up over time: you build a history of performance, sharpen your estimating, tighten governance, and become the person who can explain not just where the project is today, but where it will land if nothing changes, and what must change to hit the target.
If you want to turn EVM from theory into a core career skill, Invensis Learning’s PMP Certification Training and advanced Project Management courses go deep into earned value concepts, variance analysis, and forecasting as per PMI standards, so you can apply these techniques confidently on real projects and improve on-time, on-budget delivery.