PMP formulas are the equations Project Management Professional (PMP) candidates use to measure cost, schedule, forecasts, estimates, and risk on a project. The core set covers cost variance (CV), schedule variance (SV), the cost and schedule performance indexes (CPI and SPI), estimate at completion (EAC), variance at completion (VAC), the to-complete performance index (TCPI), PERT estimating, and expected monetary value (EMV).
Passing the PMP exam is not about becoming a calculator. It is about understanding what the numbers say about project health, schedule performance, cost efficiency, uncertainty, and risk. The PMP Examination Content Outline (ECO) that the Project Management Institute (PMI) released in July 2026 weights the exam at People (33%), Process (41%), and Business Environment (26%), and it does not list a separate bank of formulas to memorize. Formulas are best studied as decision-making tools inside real project scenarios.
This guide is updated for the 2026 exam, which has 180 questions (170 scored and 10 unscored pretest questions) in 240 minutes, according to the July 2026 ECO. Most candidates make one of two mistakes: they ignore formulas because they think the exam is "mostly mindset," or they memorize every equation without knowing when to use it. The smarter approach is to master the high-value formulas below, learn to read them quickly, and practice them in context.
Why Formulas Still Matter on the 2026 PMP Exam
The 2026 PMP exam gives strong weight to agile and hybrid approaches alongside predictive ones, and the July 2026 ECO names artificial intelligence and sustainability as newly reflected trends. Even so, formula-based thinking still matters. Project managers are expected to plan budgets, manage schedules, evaluate risk, and forecast outcomes, and formulas give a fast, objective read on all four.
The ECO also introduces case or scenario and graphic-based question types, and it describes practicum-style items that may include tools and data. Expect to read numbers from charts and case studies rather than solve bare equations. Typical prompts look like: Is the project over budget? Is performance improving? How much will the project likely cost at completion? or Which risk response option is financially smarter? If you understand what each formula means, you can often answer correctly before finishing the full calculation.
Which PMP Exam Formulas Matter Most?
The highest-value formulas relate directly to project cost, schedule, forecasting, and estimation. If you are short on study time, start with earned value management (EVM), because CV, SV, CPI, SPI, EAC, and TCPI all come from it.
Core Earned Value Inputs
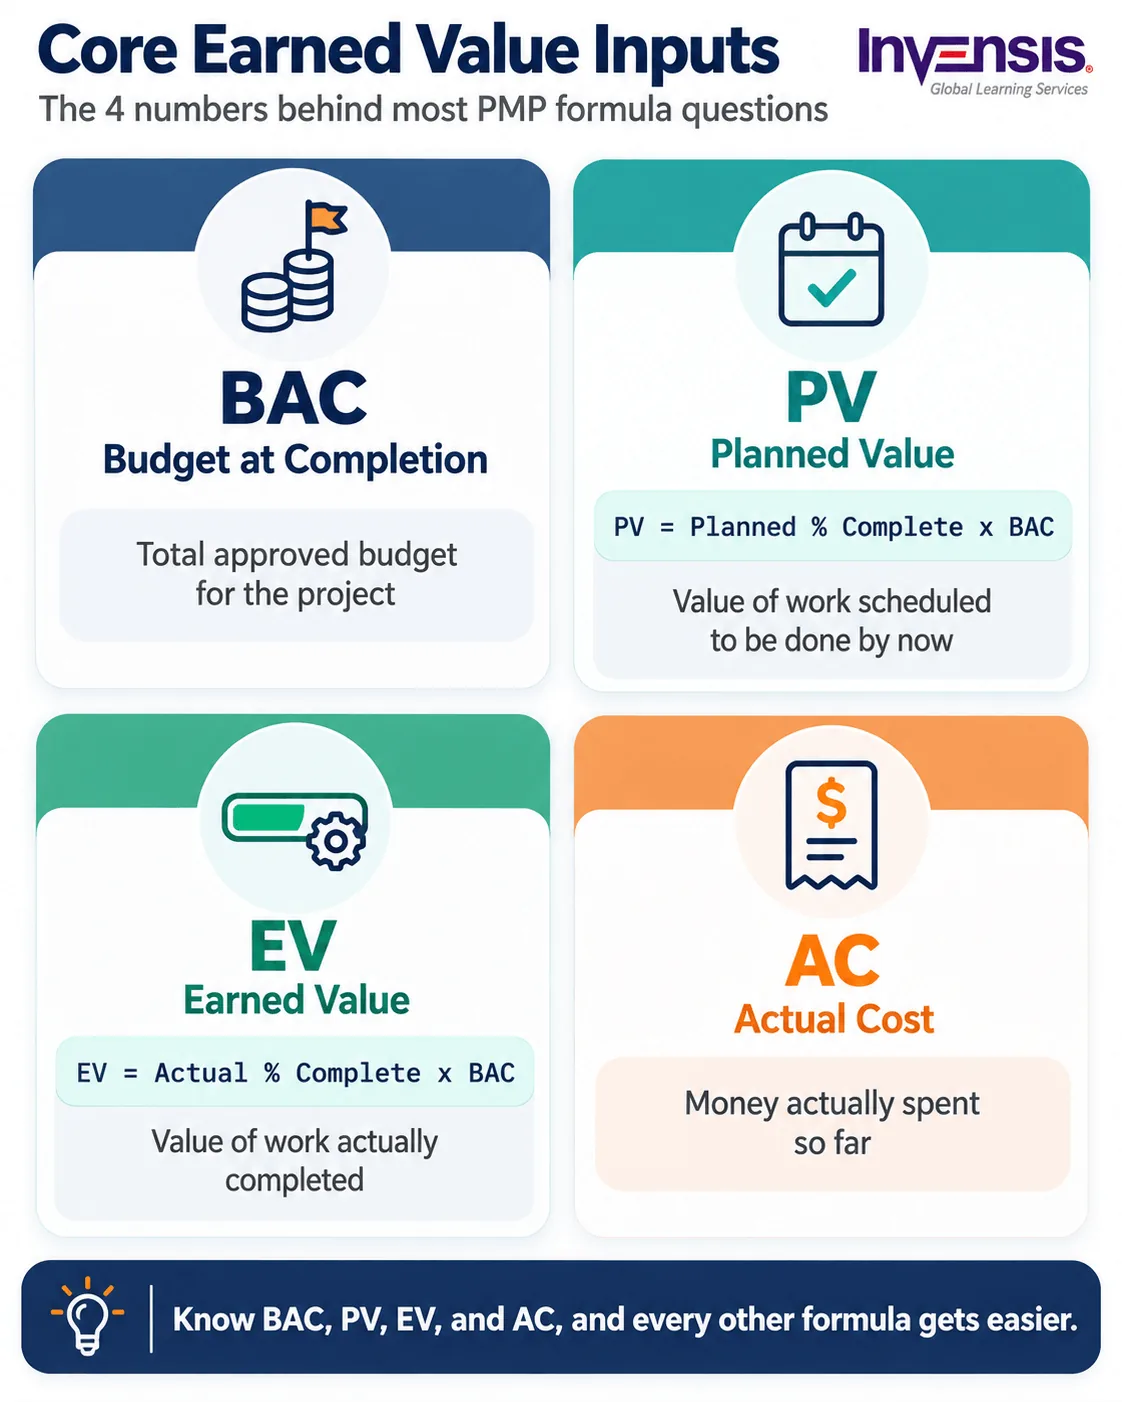
Before you can calculate performance, you need four basic inputs:
- BAC (Budget at Completion) = total approved budget for the project
- PV (Planned Value) = planned % complete x BAC
- EV (Earned Value) = actual % complete x BAC
- AC (Actual Cost) = what has actually been spent so far
These four numbers drive most formula questions. If BAC, PV, EV, and AC are clear in your mind, the rest of the formulas become much easier to remember and interpret.
Side-by-Side Comparison Table of High-Priority Formulas
| Formula | Equation | What It Tells You | How to Read It Quickly |
|---|---|---|---|
| Cost Variance (CV) | CV = EV - AC | Budget variance | Positive = under budget; negative = over budget |
| Schedule Variance (SV) | SV = EV - PV | Schedule variance | Positive = ahead of planned work; negative = behind |
| Cost Performance Index (CPI) | CPI = EV / AC | Cost efficiency | >1 good; <1 bad |
| Schedule Performance Index (SPI) | SPI = EV / PV | Schedule efficiency | >1 favorable; <1 unfavorable |
| Estimate to Complete (ETC) | ETC = EAC - AC (or BAC - EV at planned rates) | Cost still needed to finish the remaining work | Bridge into EAC logic |
| Estimate at Completion (EAC1) | AC + (BAC - EV) | Forecast if future work follows the original plan | Most optimistic |
| Estimate at Completion (EAC2) | BAC / CPI | Forecast if current cost efficiency continues | Common CPI-based forecast |
| Estimate at Completion (EAC3) | AC + ((BAC - EV) / (CPI x SPI)) | Forecast if both cost and schedule impact continue | More conservative |
| Variance at Completion (VAC) | VAC = BAC - EAC | Expected budget variance at project end | Positive = likely underrun |
| To-Complete Performance Index (TCPI) | (BAC - EV) / (BAC - AC) to meet BAC; (BAC - EV) / (EAC - AC) to meet EAC | Required cost performance for the remaining work | "Can we realistically recover?" Above 1 = harder |
| PERT Expected Time (ET) | (O + 4M + P) / 6 | Weighted duration estimate | Emphasizes the most likely outcome |
| PERT Standard Deviation | (P - O) / 6 | Estimate uncertainty | Higher value = more variability |
| Expected Monetary Value (EMV) | Probability x Impact | Financial value of a risk | Helps compare risk options |
How Do You Interpret Variance and Index Formulas?
CV and SV tell you the size and direction of variance. CPI and SPI tell you efficiency. A CPI below 1.0 means poor cost performance, while a negative CV means the project is over budget. Likewise, a positive SV or SPI above 1.0 suggests more work has been accomplished than planned. PMI also warns that an SPI above 1.0 does not automatically prove you are truly ahead of schedule if non-critical-path work is driving the numbers.
That nuance is important for exam questions. If an answer choice says, "The project is ahead of schedule because SPI is above 1.0," think more carefully. The data may show favorable schedule efficiency, but sound project management judgment still considers the critical path and the broader delivery context.
How Do You Read Forecasting Formulas?
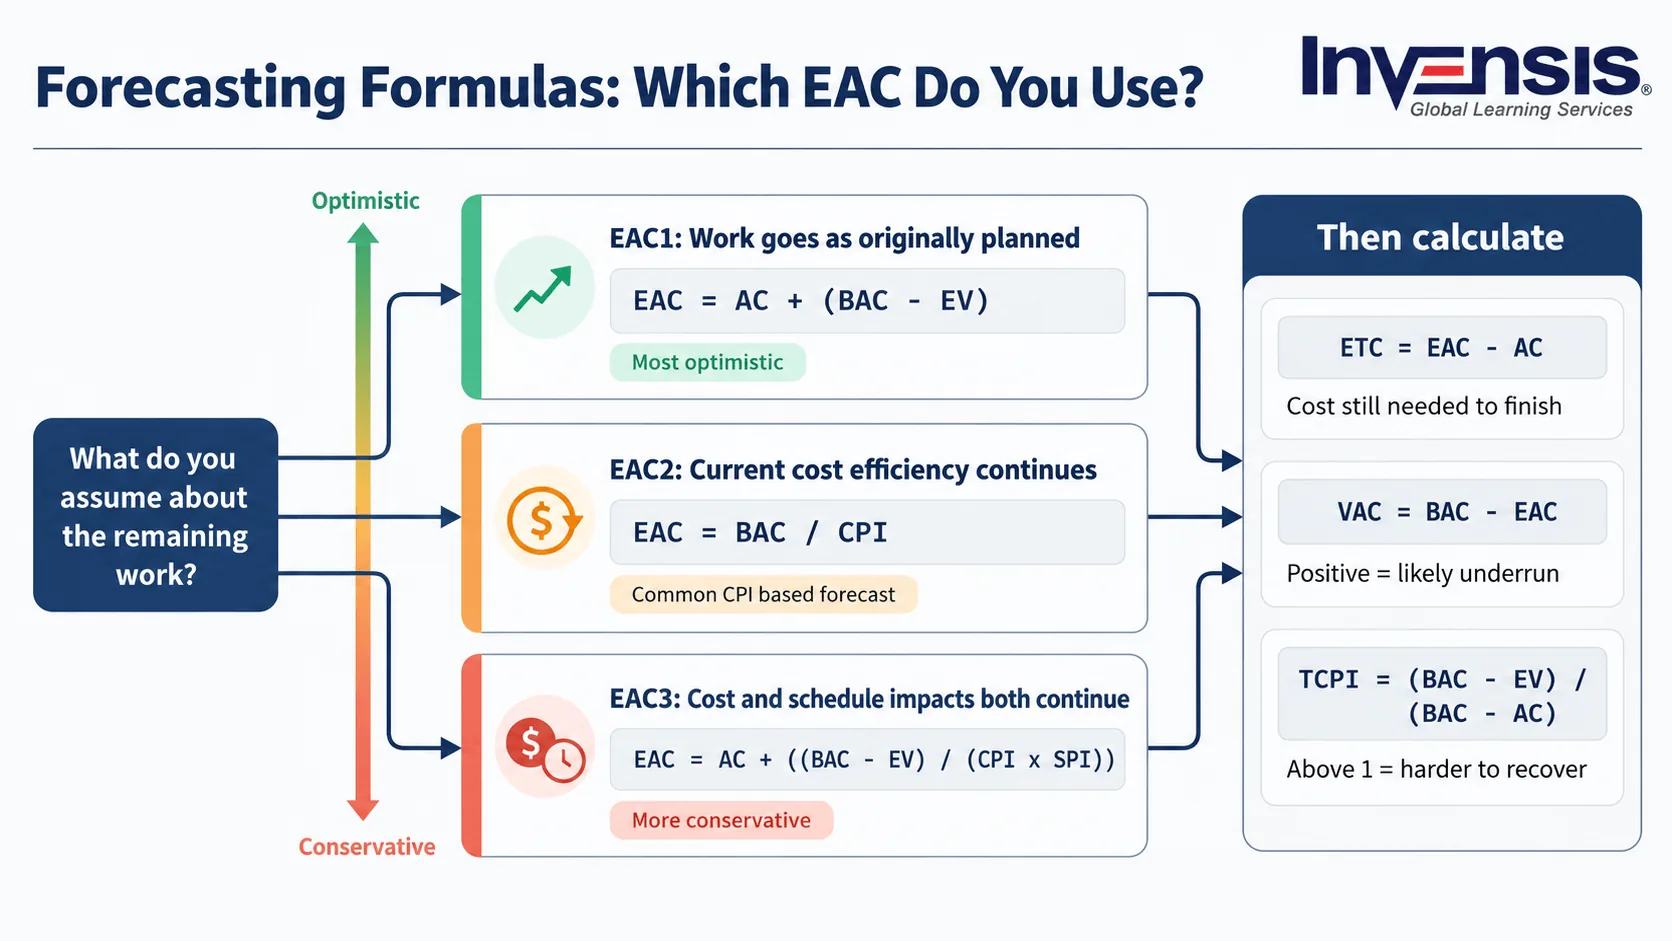
Forecasting formulas tell you where the project is likely to land if current patterns continue. PMI's earned value guidance highlights three common EAC approaches. EAC1 = AC + (BAC - EV) assumes the remaining work will go according to the original plan. EAC2 = BAC / CPI assumes current cost performance will continue. EAC3 = AC + ((BAC - EV) / (CPI x SPI)) incorporates both cost and schedule performance and is usually the most pessimistic when both are weak.
TCPI acts as a reality check on whether the future efficiency needed to hit the target budget is even realistic. On exam questions, if TCPI implies dramatic recovery while current performance is poor, the best answer usually involves reforecasting, escalating, or adjusting expectations rather than hoping performance will suddenly improve.
What Does Each Earned Value Input Mean?
A formula table gives you the structure, but exam success depends on knowing what each input measures and how to interpret the result in a project context. Questions usually ask whether a project is over budget, behind schedule, improving, or likely to miss its final target, so the meaning of each input matters more than the symbols.
Budget at Completion (BAC)
Budget at Completion (BAC) is the total approved budget for the entire project: the full amount the project was expected to cost when planning was completed. BAC is the baseline for several other earned value calculations, including planned value, earned value, estimate at completion, and variance at completion.
On the PMP exam, BAC usually appears as the reference number against which progress and forecasts are measured. It says nothing about performance on its own, but it anchors nearly every cost-based formula in the earned value family.
Planned Value (PV)
Planned Value (PV) is the budget allocated to the work scheduled for completion by a given date, based on the original schedule and plan. In simple terms, PV answers the question: "How much work did we plan to complete by now?"
PV is the benchmark for schedule variance and the schedule performance index. If EV is lower than PV, the team has completed less work than expected by this point.
Earned Value (EV)
Earned Value (EV) is the budgeted value of the work actually completed so far. It is one of the most important concepts in earned value management because it combines budget and progress into a single number.
EV is not the same as the money spent, and that confusion causes many mistakes. EV tells you the value of completed work, while AC tells you what you spent to achieve it. On exam questions, EV is often the bridge between schedule and cost interpretation.
Actual Cost (AC)
Actual Cost (AC) is the amount of money actually spent on the project up to the present point. It is simple compared with the other inputs, but it is essential because it lets you compare what you have spent against what you have earned.
In exam questions, AC usually works together with EV. If AC exceeds EV, cost efficiency is poor. If AC is lower than EV, the project is spending efficiently relative to completed work.
Cost and Schedule Variance Formulas
Cost Variance (CV)
Cost Variance (CV = EV - AC) shows whether the project is under or over budget at a given point in time. A positive result means the project is under budget; a negative result means it is over budget.
- Positive CV = favorable
- Negative CV = unfavorable
CV is useful when a question asks whether costs are being controlled effectively. A negative CV is a warning sign that spending has exceeded the value of the work completed. Tracking CV regularly is a core part of project cost management, where budgets are estimated, baselined, and controlled throughout the project.
Schedule Variance (SV)
Schedule Variance (SV = EV - PV) shows whether the project has completed more or less work than planned at a given point. A positive SV means the project has accomplished more work than scheduled. A negative SV means it has completed less than planned.
A positive SV or strong SPI does not always prove the project is truly ahead in every practical sense, because teams may finish non-critical-path work while still being exposed on the critical path. Exam questions sometimes test exactly this detail.
Performance Index Formulas
Cost Performance Index (CPI)
Cost Performance Index (CPI = EV / AC) measures cost efficiency: how much value the project earns for every unit of cost spent. PMI's article on making earned value work gives a useful interpretation: a CPI of 0.83 means that for every dollar spent, only $0.83 in value is earned. The rule is simple:
- CPI > 1 = good cost efficiency
- CPI = 1 = exactly on budget
- CPI < 1 = poor cost efficiency
CPI matters on the exam because it often feeds forecasting formulas such as EAC. If current cost performance is weak, forecasts based on CPI will usually indicate a budget overrun.
Schedule Performance Index (SPI)
Schedule Performance Index (SPI = EV / PV) measures schedule efficiency relative to the original plan. If SPI is above 1, progress is favorable. If it is below 1, progress is lagging behind the plan.
PMI specifically warns that an SPI above 1.0 does not automatically mean the project is ahead of schedule in the real-world sense of delivery. It may simply mean more work has been accomplished than planned, not necessarily the right work on the critical path.
Forecasting Formulas
Estimate to Complete (ETC)
Estimate to Complete (ETC) is the expected cost to finish the remaining project work. The general form is ETC = EAC - AC. When the remaining work is expected to proceed at the originally budgeted rate, it simplifies to ETC = BAC - EV, the remaining planned budget for work not yet earned.
ETC is the bridge into estimate at completion. When the original estimate is no longer valid, the team builds a fresh bottom-up ETC, and the forecast becomes EAC = AC + bottom-up ETC. On exam questions, ETC is often implied inside larger forecasting logic.
Estimate at Completion (EAC1)
EAC1 = AC + (BAC - EV) is the most optimistic of the common EAC approaches because it assumes the remaining work will be completed according to the original plan, even if performance has varied so far.
This version fits when current problems are considered one-time or temporary and future work is expected to return to planned performance. In other words, it assumes the past will not strongly distort the future.
Estimate at Completion (EAC2)
EAC2 = BAC / CPI forecasts the final project cost by assuming current cost efficiency will continue for the rest of the project. It is the usual choice when present cost performance is expected to persist.
This is often the most intuitive forecasting formula because it links directly to CPI. If the project is inefficient now, the formula assumes it will stay inefficient, which usually makes EAC2 a more realistic forecast than EAC1 on troubled projects.
Estimate at Completion (EAC3)
EAC3 = AC + ((BAC - EV) / (CPI x SPI)) adds both cost and schedule performance into the forecast. It often produces the most pessimistic estimate when the project is underperforming on both fronts, for example when a fixed deadline forces costly schedule recovery.
The three EAC formulas are not interchangeable. Each one reflects a different assumption about the future, and choosing the right one is exactly the kind of interpretive judgment PMP candidates need.
Variance at Completion (VAC)
Variance at Completion (VAC = BAC - EAC) shows the expected budget difference at the end of the project by comparing the original total budget with the latest forecast. A positive VAC means the project is forecast to finish under budget; a negative VAC means it is forecast to finish over budget.
CV tells you where you are now, while VAC tells you where you are likely to end up. Many candidates confuse current variance with final forecast variance, so keep the two separate.
To-Complete Performance Index (TCPI)
To-Complete Performance Index (TCPI) measures the cost performance required on the remaining work to meet a target. To finish within the original budget, TCPI = (BAC - EV) / (BAC - AC). Once a new forecast is approved, TCPI = (BAC - EV) / (EAC - AC).
TCPI looks forward, not back. It asks: "How efficiently do we now need to perform to still hit our budget goal?" A TCPI above 1 means the remaining work must be done more efficiently than planned. If that required performance looks unrealistic, the project manager may need to reforecast, escalate, or revise expectations.
Estimating Formulas
Estimating formulas turn uncertain ranges into usable numbers for schedules and budgets. They work best as part of a disciplined approach to project estimation, where the inputs come from experts, historical data, and the team doing the work.
PERT Expected Time (Beta Distribution)
PERT Expected Time = (O + 4M + P) / 6 is the weighted form of three-point estimating. It uses optimistic, most likely, and pessimistic estimates and gives more influence to the most likely case, which makes it more practical than a simple average. The three inputs are:
- O = optimistic time, the shortest realistic duration.
- M = most likely time, the duration most expected to occur.
- P = pessimistic time, the longest likely duration.
This formula helps teams estimate uncertain work more realistically, and it often appears in schedule questions tied to estimating activity durations or risk-aware planning. In practice, these inputs usually come from the team's effort estimation, which sizes the work in hours or person-days before durations are scheduled.
Triangular Distribution Estimate
The triangular estimate = (O + M + P) / 3 is a simple average that gives each input equal weight. Read the question carefully: "triangular" or "simple average" points to this version, while "beta" or "PERT" points to the weighted one. With O = 4 days, M = 6 days, and P = 14 days, the triangular estimate is 8 days and the PERT estimate is (4 + 24 + 14) / 6 = 7 days.
PERT Standard Deviation and Variance
PERT Standard Deviation = (P - O) / 6 measures the spread, or uncertainty, in the estimate. Squaring it gives the variance. Using the same inputs, the standard deviation is (14 - 4) / 6 = 1.67 days.
A larger standard deviation means greater uncertainty. This helps candidates understand that not all estimates carry the same level of confidence, even when their expected values match. For a closer look at how optimistic, most likely, and pessimistic values are gathered in the first place, see this guide to three-point estimating.
Risk Formula
Expected Monetary Value (EMV)
Expected Monetary Value (EMV = Probability x Impact) assigns a financial value to a risk event so response options can be compared rationally. For example, if a risk has an 80 percent chance of causing a $30,000 loss, the EMV is $24,000. Threats are usually entered as negative values and opportunities as positive ones, so summing EMVs shows the net exposure.
EMV is not the actual loss that will happen if the risk occurs. It is a decision-making value used for planning and comparison, and questions may try to confuse expected value with real impact. EMV sits alongside decision trees and simulation among the common risk analysis methods. The same calculation also drives decision-tree analysis and contingency reserve sizing, as explained in our guide to expected monetary value (EMV).
Taken together, these formulas help project managers measure present performance, forecast future outcomes, improve estimates, and compare risk intelligently. Once you know what a formula measures and how to interpret a favorable or unfavorable result, formula-based questions become much easier to manage.
Other Formulas Worth Knowing
Two non-EVM formulas still show up in practice questions on communication and scheduling.
Communication Channels
Communication channels = n(n - 1) / 2, where n is the number of people involved. A team of 10 has 45 channels; adding 2 people raises it to 66, so 21 new channels appear. That growth is why coordination effort rises quickly with team size and why a written communication plan matters on larger projects.
Float (Slack)
Total float = LS - ES (or LF - EF) shows how long an activity can slip without delaying the project end date. Activities with zero total float sit on the critical path. For forward and backward pass steps, see this guide to the critical path method.
Worked Example: Calculating CV, SPI, EAC, and TCPI on One Project
Working one data set end to end is the fastest way to make the formulas stick. Assume a project with a BAC of $100,000. By month 6, the plan called for 50% of the work to be complete, the team has actually completed 40%, and $50,000 has been spent.
| Metric | Calculation | Result | What It Means |
|---|---|---|---|
| PV | 50% x $100,000 | $50,000 | Value of work planned by month 6 |
| EV | 40% x $100,000 | $40,000 | Value of work actually done |
| CV | $40,000 - $50,000 | -$10,000 | Over budget |
| SV | $40,000 - $50,000 | -$10,000 | Behind planned work |
| CPI | $40,000 / $50,000 | 0.80 | $0.80 of value per $1 spent |
| SPI | $40,000 / $50,000 | 0.80 | Progressing at 80% of the planned rate |
| EAC1 | $50,000 + ($100,000 - $40,000) | $110,000 | If remaining work goes to plan |
| EAC2 | $100,000 / 0.80 | $125,000 | If a CPI of 0.80 continues |
| EAC3 | $50,000 + $60,000 / (0.80 x 0.80) | $143,750 | If both indexes keep dragging |
| ETC | $125,000 - $50,000 | $75,000 | Still needed to finish (using EAC2) |
| VAC | $100,000 - $125,000 | -$25,000 | Forecast overrun (using EAC2) |
| TCPI (to BAC) | ($100,000 - $40,000) / ($100,000 - $50,000) | 1.20 | Must jump from 0.80 to 1.20 efficiency |
A jump from a CPI of 0.80 to 1.20 on the remaining work is rarely realistic. The stronger exam answer is to analyze the root cause, reforecast with an appropriate EAC, and communicate the revised forecast to stakeholders rather than promise to recover the original budget.
How to Use the Formulas in Exam Scenarios
The PMP exam is rarely about bare calculations. It is usually about interpreting the result correctly and deciding what a competent project manager should do next. Practice formulas in two layers: first calculate, then interpret. Reviewing PMP case studies across different industries is a practical way to see how these numbers drive real project decisions.
For example, if CV is negative and CPI is below 1, the project is over budget and spending inefficiently. If SV is negative and SPI is below 1, the project is behind planned progress. If VAC is negative, the project is forecast to finish over budget. These interpretations often matter more than the arithmetic because the exam tests whether you can make sound project judgments.
A smart exam technique is to memorize directional meaning first:
- Positive variance = favorable
- Negative variance = unfavorable
- Index above 1 = favorable (except TCPI, where above 1 means harder)
- Index below 1 = unfavorable
This simple framework helps you eliminate weak answer choices even when you do not fully calculate every detail.
Common Formula Mistakes PMP Candidates Make
One common mistake is memorizing formulas without understanding the story behind them. If you cannot explain EV, PV, and AC in plain English, the derived formulas will never feel stable under pressure. Another is confusing variance with index formulas: variance formulas subtract values, while index formulas divide them, which changes both the result type and how you read it.
A second major mistake is over-reading SPI. PMI notes that an SPI greater than 1.0 does not automatically mean the project is ahead of schedule in every practical sense, because non-critical-path work can distort the picture. Candidates who remember formulas but ignore context often fall for this trap.
A third mistake is choosing the wrong EAC formula. Read the scenario for clues: if the variance was a one-time event, use AC + (BAC - EV); if current cost performance is expected to continue, use BAC / CPI; if a fixed deadline is also driving cost, use the CPI x SPI version.
Conclusion
PMP formulas are not meant to be memorized in isolation; they are tools that help you interpret what is really happening in a project. When you understand what CPI, SPI, EAC, TCPI, and EMV are telling you, you move beyond calculation and into decision-making. The exam tests exactly this ability: whether you can read project health, forecast outcomes, and respond like a competent project manager in real scenarios.
If you want to build that clarity with guided practice, structured PMP certification training helps you connect each formula with realistic exam scenarios, so you know when to apply it, how to interpret it, and how to use it under time pressure.
Frequently Asked Questions
Do I need to memorize every PMP formula for the exam?
No. PMI's July 2026 PMP Examination Content Outline does not list formulas as a separate domain or a required formula bank. You should still know the high-value earned value, forecasting, estimating, and risk formulas well enough to apply them inside scenario and graphic-based questions.
Is a calculator allowed on the PMP exam?
You cannot bring your own calculator. The exam software provides a basic on-screen calculator, and it is enough for the arithmetic that PMP questions require.
How many formula questions are on the PMP exam?
PMI does not publish a count of calculation questions, and the exam content outline assigns no separate weight to formulas. Most formula knowledge is tested through interpretation, such as reading CPI or SPI values in a scenario or a chart, rather than through long calculations.
Can earned value ever be greater than the budget at completion?
No. Earned value is the budgeted value of completed work, so it can only rise until all planned work is done, at which point EV equals BAC. If a calculation produces EV above BAC, recheck the percent-complete figure or the baseline.
Why does SPI return to 1.0 on a project that finished late?
At completion, all planned work has been earned, so EV equals PV and SPI equals 1.0 even if the project finished late. That is why SPI loses meaning near the end of a project and why schedule performance should also be checked against the critical path and actual finish dates.
What is the difference between BAC and EAC?
BAC is the original approved budget and stays fixed unless the baseline is formally changed. EAC is the current forecast of total cost based on performance so far, so it changes as the project progresses. The gap between the two is the variance at completion, calculated as BAC minus EAC.