

Ask any experienced project manager, and they’ll tell you: the real challenge isn’t planning, it’s making the right decisions, at the right time, with the right people.
In today’s projects, that’s easier said than done. On one side, you have remote teams working across time zones and tools. On the other, project managers are juggling shifting priorities, tight deadlines, and constant change.
It only takes one unclear decision to derail progress, a simple change request, an unassigned owner, or a delayed response, and suddenly everything stalls. In fact, according to a research report on large-scale construction projects, delays in stakeholder decision-making are a major cause of slowdown, with missing approvals, incomplete documentation, and lack of coordination frequently cited as key blockers.
That’s why more and more teams are turning to decision flowcharts, not just as visual aids, but as practical tools to untangle complex decisions and avoid unnecessary delays. They help teams stay aligned when it matters most, offering a clear path forward when decisions involve trade-offs, multiple stakeholders, or approval chains.
Instead of relying on meetings or guesswork, teams can lay out their decision paths in advance, making it easier to move forward with confidence, even under pressure.
| Did you know?
According to a study by Erik Larson, Co-Founder and Chief Product Officer at Cloverpop, “businesses using a decision-making checklist or framework make decisions twice as fast with 75% better outcomes and 20% improved performance.” |
That kind of impact is exactly why decision flowcharts are gaining traction they bring order to judgment calls and turn scattered input into a shared path forward. In this guide, we’ll walk you through what decision flowcharts are, when to use them, and how to build them for real-world project scenarios. You’ll also receive a downloadable template, practical case studies, and expert tips to help you avoid common mistakes.
If you’ve ever felt like project decisions are slipping through the cracks, decision flowcharts help bring everything, and everyone, back into alignment.
Table of Contents
What is a Decision Flowchart in Project Management?
Why Project Managers Need Decision Flowcharts in 2025
Step-by-Step Guide: Creating Decision Flowcharts for PM Use
Free Decision Flowchart Template for Project Managers
Real Project Examples: Decision Flowcharts in Action
Best Practices and Common Pitfalls
What is a Decision Flowchart in Project Management?
In any project, decisions aren’t isolated events; they’re part of a chain reaction. One choice influences another, which in turn reshapes timelines, resource allocations, risks, or stakeholder expectations. A decision flowchart is a tool that helps project managers map this chain before it unfolds.
At its core, a decision flowchart is a visual representation of a decision-making framework. It lays out the key decision points in a project, the conditions attached to each, and the resulting actions or outcomes. Unlike traditional process flowcharts, which display linear task sequences, a decision flowchart doesn’t just show what happens next, it maps the logic behind each choice, making it clear why a decision is made, and under what conditions.
According to the Project Management Institute (PMI), 23% of failed projects can be traced back to poor decision-making or delayed approvals. Tools like decision flowcharts help avoid this by clarifying who makes decisions, when, and under what conditions, thereby bringing both structure and speed to the process.
Components of a Decision Flowchart
A well-structured decision flowchart is built using a set of standardized elements:
- Start and End Points: These define the entry and exit of the decision flow. Usually represented as ovals or rounded rectangles, they establish the scope of the decision-making process.
- Decision Nodes: Shown as diamonds, these nodes represent critical questions or checkpoints. For example: Is the estimated cost within budget? Or Does this change align with business objectives?
- Action Steps: These are depicted as rectangles and indicate the actions that should be taken if a particular path is followed, such as initiating the procurement process or escalating to the change control board.
- Branches and Connectors: Arrows link decision points and actions, often labelled with “Yes,” “No,” or other conditional responses to show the flow of logic.
Each decision point acts like a fork in the road. Depending on how the criteria are met, or the conditions are evaluated, the flowchart outlines all possible next steps, creating a visual representation of the project’s potential paths.
Why Smart Project Teams Rely on Decision Flowcharts Today
In a world where decisions are more complex, more frequent, and higher-stakes than ever, project managers need tools that do more than record what comes next, they need tools that structure how thinking happens. According to a Gartner’s report, 65% of business decisions are now more complex than they were just two years ago, often involving more data, more stakeholders, and greater risk. To manage this rising complexity, decision flowcharts offer a practical solution, a visual framework that helps teams bring structure to their thinking, surface hidden assumptions, and reach alignment before execution begins.
1. Mapping the Flow Brings Structure to Complex Decisions
Today, project decisions often involve multiple moving parts, dependencies, approvals, and trade-offs that need to be clearly understood before action is taken. With distributed teams and compressed timelines, there’s little room for hesitation or misalignment when a decision point arrives.
Creating a decision flowchart helps teams lay out that complexity in advance. It clarifies how each decision should unfold, what conditions apply, and who’s responsible, turning uncertainty into structure. For smart project teams, this isn’t just documentation, it’s a planning tool that shapes thinking and accelerates execution when speed matters most.
| A study analyzing 50 IT projects found a strong positive relationship between project complexity and both schedule and cost overruns, meaning more complex projects are consistently more likely to suffer delays and budget issues. This underscores why structured decision-making is so critical in today’s environment. The more complex the project, the greater the need to think through decisions, define conditions, and refine paths before execution. |
2. Keeps Cross-Functional Teams Aligned on How Decisions Are Made
In today’s project environments, teams rarely sit under one roof or follow the same playbook. Cross-functional collaboration now spans time zones, tools, and priorities, making it easy for decision-making processes to get lost in translation.
A decision flowchart gives everyone a shared map. It shows how decisions will be made, what criteria need to be met, and who owns each step, regardless of role or location. Instead of relying on scattered conversations or assumptions, teams align on the how of decision-making from the start, reducing confusion and keeping execution on track.
3. Helps You Communicate Decision Logic to Stakeholders Upfront
In today’s projects, stakeholder involvement doesn’t happen only at kickoff and delivery, it’s ongoing, fast-moving, and often layered with shifting expectations. Sponsors, clients, and internal approvers are pulled into decisions midstream, and they need clarity to respond quickly and confidently.
That’s why strategic teams use decision flowcharts during stakeholder alignment conversations, not after the fact, but early in the planning process. By presenting a clear view of how key decisions will be made, including conditions like budget thresholds, escalation triggers, and decision owners, teams help stakeholders understand the logic behind the plan. It builds alignment upfront, reduces friction later, and ensures key players aren’t just aware, they’re committed.
4. Enables Faster, Clearer Decisions Under Pressure
When pressure is high, deadlines closing in, scope shifting, or a blocker threatening progress, teams can’t afford decision paralysis. Yet this is exactly when confusion peaks: who’s accountable, what criteria apply, and what’s the downstream impact? Decision flowcharts counter that chaos by laying out a pre-agreed path. They capture logic, thresholds, and escalation points before the pressure hits, allowing teams to respond swiftly without pausing to re-evaluate from scratch.
This kind of visual foresight is what makes decision flowcharts indispensable in today’s fast-paced environments. Instead of relying on rushed conversations or gut instincts, project managers can lean on a documented framework that’s already been aligned on, enabling faster calls, fewer missteps, and greater confidence under stress. It’s not just about speed; it’s about speed with clarity.
| McKinsey reports that teams that make decisions quickly are twice as likely to make high-quality decisions, underscoring the power of clarity and speed. |
5. Reveals Decision Delays, Gaps, and Approval Bottlenecks Before They Cost You
Even the best-laid project plans can fall apart if key decisions get stuck in limbo. Missed approvals, undefined owners, or unclear escalation paths often become the hidden blockers that drain momentum, and by the time the issue surfaces, the damage is already done. Decision flowcharts help project managers expose these risks early by forcing clarity on who decides what, under what conditions, and by when.
By mapping decision logic visually, teams can quickly identify missing roles, redundant steps, or unclear handoffs before execution begins. This proactive visibility prevents last-minute scrambles and ensures that every critical path is backed by timely, accountable decisions. It’s not just about efficiency, it’s about preventing silent slowdowns that quietly erode project timelines and team trust.
6. Lays the Foundation for Consistent, Scalable Decision Governance
As projects grow in size, complexity, and visibility, inconsistent decision-making becomes a liability. What worked in a three-person sprint quickly breaks down across distributed teams, multiple vendors, or compliance-heavy environments. Decision flowcharts act as the foundation for scalable governance by creating a standardized logic for how similar types of decisions are handled, regardless of who’s making them.
By codifying decision conditions, thresholds, and ownership, teams can apply the same structure across initiatives, reducing rework and confusion. Whether you’re onboarding new team members or replicating a project model across regions, flowcharts help maintain clarity and accountability without reinventing the wheel each time. They turn one-off calls into repeatable decision models.
7. Keeps Fast Decisions Aligned with Project Goals and Constraints
Speed without alignment is dangerous, especially when decisions impact budget, timelines, or stakeholder commitments. In fast-moving projects, teams often make quick calls that solve immediate problems but inadvertently create downstream issues. Decision flowcharts help guardrail that risk by anchoring choices in predefined project priorities, criteria, and constraints.
Instead of reacting in the moment, teams use flowcharts to check decisions against strategic objectives, resource limits, or regulatory conditions, ensuring that what’s expedient doesn’t undermine what’s essential. It’s how high-performing teams move fast without veering off course.
How to go About Creating a Decision Flowchart for Project Management?
A decision flowchart isn’t just a diagram; it’s a structured thinking tool that guides project management teams through choices, trade-offs, and next steps. To be effective, it must reflect how decisions are truly made based on data, roles, risks, and outcomes.
Here’s a detailed guide that breaks down each step, from initial scoping to system integration so that project managers can build reliable and scalable decision flowcharts.
1. Identify the Core Decision and Its Context
Begin by defining the decision the flowchart addresses. Be specific.
- Is it a one-time project decision (e.g., “Should we launch this product now?”) or a recurring operational decision (e.g., “Do we approve this change request?”)?
- What triggers this decision, a stakeholder request, a KPI threshold, or a risk event?
- What’s at stake, time, cost, scope, compliance, customer experience?
Tip: Don’t attempt to solve multiple decisions in one flowchart. One chart = one clear decision logic.
Also, identify the decision’s scope:
- Who are the decision-makers (Sponsor, PMO, Product Owner)?
- Who provides inputs or data (Analysts, QA, Ops)?
- Who must be informed once a decision is made?
This stakeholder mapping will inform both the decision logic and flowchart handoff points.
2. Break Down the Decision Criteria
Once you’ve defined the “what,” break down the “how.”
Ask:
- What criteria are used to evaluate the decision?
- Are these binary (yes/no), threshold-based (e.g., “If cost increase > 10%”), or multi-factor?
- Are any criteria mandatory or weighted?
Create a decision logic matrix if needed. For example:
| Criteria | Condition | Weight | Source |
| Cost Impact |
< 10% of total budget | High | Finance |
| Timeline Shift |
< 1 Sprint | Medium | PMO |
| Regulatory Risk |
None | Mandatory Blocker | Compliance |
This clarity ensures that the flowchart logic is objective and defensible, especially when decisions are audited or challenged later.
3. Draft the Initial Flow – Decisions, Paths, and Outcomes
Now, begin sketching the flow:
- Start with an Entry Point. What triggers this decision process?
- Map each decision node clearly with a specific ‘yes/no’ or condition check.
- Define actions or follow-ups that correspond to each decision path.
- End with concrete outcomes, approval, escalation, rejection, or deferment.
Example:
- Trigger: Change Request Submitted
- Decision 1: Is it within the budget impact threshold?
- Yes: Proceed to technical feasibility check
- No: Escalate to Steering Committee
- Decision: Is technical risk low?
- Yes: Approve and assign task
- No: Return to the requester for redesign
4. Use Formal Notation for Clarity and Standardization
Visual structure is not just for aesthetics; it enables faster team understanding.
Use standard shapes:
- Oval/Rounded Rectangle: Start/Endpoints
- Rectangle: Action step
- Diamond: Decision point
- Arrow: Logical flow direction
- Circle/Connector: Off-page reference or loop
Each shape should be labeled clearly. Avoid long descriptions, keep it to a few words per shape, and explain additional details in a legend or side note.
Avoid:
- Crisscrossing arrows
- More than 2–3 branches from one decision node
- Nested logic that forces readers to backtrack
5. Test the Flow from Multiple Scenarios
Before finalizing, test the flowchart against various situations. Use real past project cases if possible.
- What happens in an edge case?
- Are all known exceptions covered?
- What if data is missing or ambiguous? Does the flow support escalation?
This is also a good time to review decision latency, how long each path takes, and who owns each step. Map this to your RACI chart if available.
6. Involve Stakeholders for Validation and Buy-In
No decision flowchart is useful if the people involved don’t trust or understand it.
Bring in key roles:
- Project sponsors or decision-makers
- Technical leads or SMEs
- Change control board or compliance officers
Ask them:
- Is this how decisions are made today?
- What bottlenecks or politics are missing?
- Would this flow still work under pressure?
Document any disagreements or changes; these insights are often more valuable than the flowchart itself.
7. Integrate into Your PM Environment
Finally, embed the flowchart into operational use:
- Add it to your templates, SOPs, or onboarding documents.
- Link it within your project management software (e.g., Confluence, Asana, Jira, Notion)
- If decisions are part of automated systems, work with developers or automation experts to encode logic into tools or bots.
A well-crafted decision flowchart serves as a decision-making protocol, keeping teams aligned, accelerating response times, and enhancing the traceability of critical choices. And in high-stakes, multi-stakeholder projects, that structure can be the difference between reactive confusion and calm, confident execution.
Free Decision Flowchart Template for Project Managers
Every project involves decision points, some straightforward, others highly complex. To manage these effectively, project managers require tools that provide structure, clarity, and efficiency. That’s exactly what our free, editable Decision Flowchart Template for PowerPoint is designed to provide.
This downloadable resource includes:
- A complete symbol reference slide to help identify and use standard flowchart elements correctly
- Two real-world decision flowchart examples, each fully editable and customizable
- A flexible layout that supports project planning, decision documentation, and stakeholder communication
Template 1: Multi-Stage Decision Tree
This free template represents a branching decision flow, ideal for scenarios where each choice opens up new decision paths. Starting with a central decision node, the flow expands based on Yes/No responses, mapping out a detailed progression of actions and outcomes.
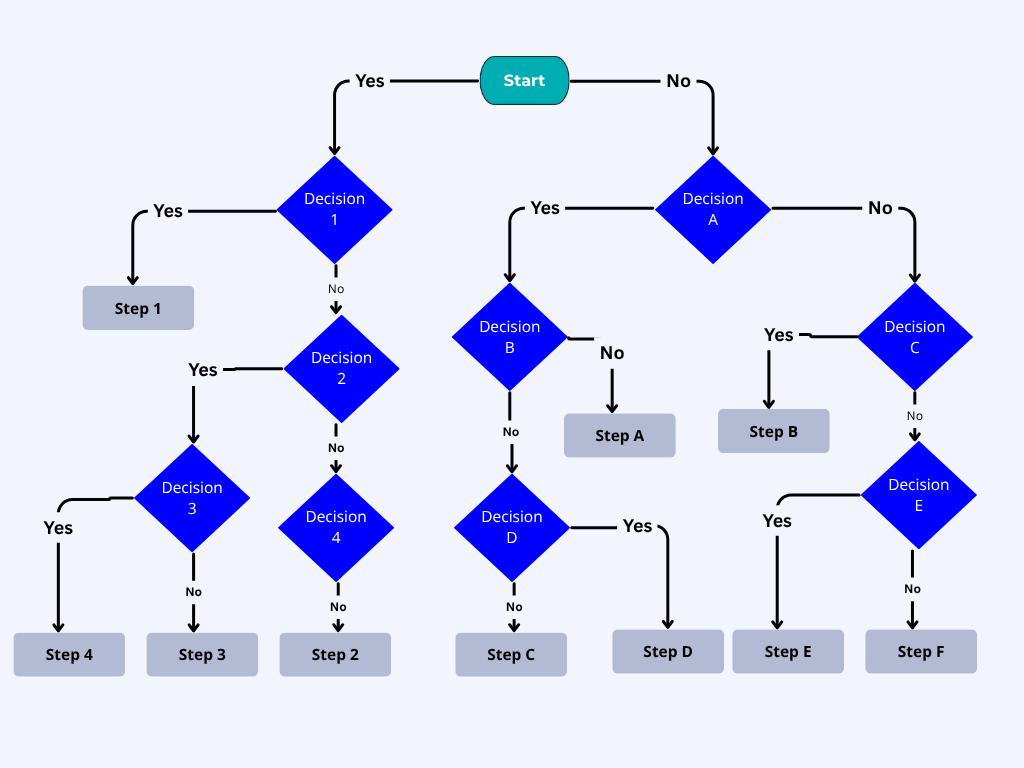
Use this format when your project involves:
- Complex approval chains or multi-step evaluations
- Risk response planning and mitigation workflows
- Cross-functional decision-making that involves multiple teams or departments
- Standardizing how similar types of decisions are made across projects
This layout is particularly effective when clarity and auditability of decision logic are essential.
Template 2: Condition-Based Decision Flow
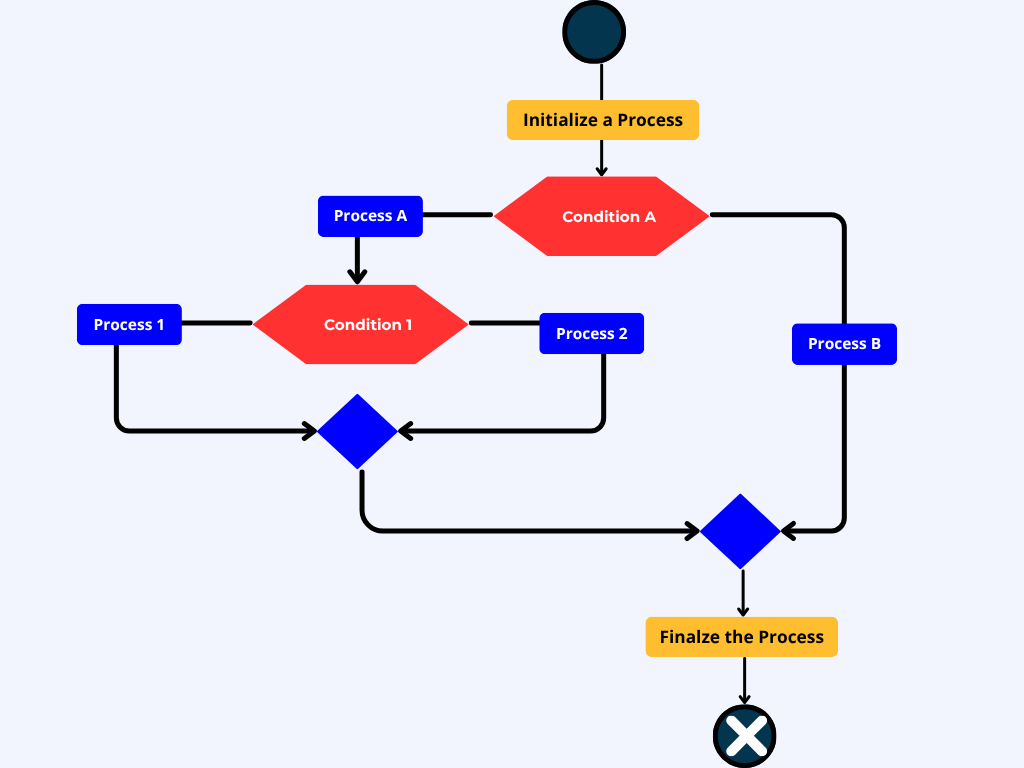
The second flowchart illustrates a condition-driven logic flow, which is useful for processes that depend on specific criteria being met before proceeding. It begins with a defined trigger or starting event, followed by evaluations (conditions) that lead to different outcomes or actions.
This structure is well-suited for:
- Change request evaluation or escalation procedures
- Product development or testing workflows
- Compliance and audit-triggered decisions
- Any project phase where progression depends on meeting a defined set of conditions
The visual layout ensures that all conditions are considered before final action is taken, helping avoid oversight or rework.
How to Use the Template?
- Refer to the flowchart symbol key to identify what each shape represents (e.g., diamonds represent decisions, rectangles represent processes, and cylinders represent data).
- Use arrows to indicate the flow of logic, clearly labeling ‘Yes ‘/’No’ or conditional outcomes.
- Replace the placeholder text with your actual decision points, steps, and criteria.
- Customize colors, labels, and structure to match your project scenario, stakeholder preferences, or documentation standards.
- Share with your team during planning meetings, reviews, or training to drive alignment.
These templates are designed to facilitate faster, more transparent, and consistent decision-making, especially in complex or high-stakes project environments.
Download your copy and start structuring your decisions with clarity and confidence.
Real Project Examples: Decision Flowcharts in Action
These real-world examples demonstrate that decision flowcharts are not merely theoretical tools, but practical assets utilized at critical stages in project delivery. Whether you’re developing software, launching a marketing campaign, or responding to emerging risks, a decision flowchart can simplify the complexity and bring structure to critical moments.
Case Study 1: Change Management in a Software Development Project
Scenario:
A mid-size fintech company is halfway through a core platform upgrade when the product team requests a change in the UI framework to improve customer usability. The PM must decide whether to approve the change without derailing the schedule or exceeding the budget.
Flow Overview:
- Start: Change Request Submitted
- Decision: Is it a regulatory requirement?
- Yes: Auto-approve
- No: Proceed to next decision
- Decision: Is the impact within the contingency buffer (time & cost)?
- Yes: Approve with internal reallocation
- No: Escalate to Steering Committee
- Decision: Does the Steering Committee approve the trade-off?
- Yes: Update scope and rebaseline
- No: Defer to post-launch roadmap
Value Add:
This flow helps stakeholders understand why not all changes can be absorbed mid-cycle and gives the PM a transparent tool to defend prioritization under pressure.
Case Study 2: Go/No-Go Decision for a Marketing Campaign Launch
Scenario:
A global retailer is about to launch a multi-channel marketing campaign. With high stakes around product availability, supply chain risks, and partner readiness, leadership wants a structured review before the green light.
Flow Overview:
- Start: Campaign Launch Review Meeting
- Decision: Are all creative assets approved and localized?
- No: Delay launch by 3 days
- Yes: Continue
- Decision: Inventory availability across regions > 90%?
- No: Recalibrate campaign regions or delay
- Yes: Proceed
- Decision: Are all partner platforms ready and tested?
- No: Partial launch with direct channels only
- Yes: Launch fully across all channels
Value Add:
This flow helps align marketing, operations, and partner teams under a single shared logic, avoiding last-minute missteps. It creates an auditable record of pre-launch validation.
Build Smarter Flowcharts: Key Practices and Mistakes to Avoid
A well-crafted decision flowchart can bring clarity to even the most complex project decisions. But when poorly designed, it can confuse stakeholders, derail communication, and hinder progress. To make your decision flowcharts actionable and effective, follow these best practices and avoid common mistakes.
Best Practices for Creating Effective Decision Flowcharts
1. Use standard flowchart symbols consistently
Stick to universally accepted symbols such as:
- Ovals for Start and End points
- Diamonds for Decision nodes
- Rectangles for actions or processes
- Arrows to show the direction of the flow
This not only enhances readability but also makes it easier for stakeholders to interpret your chart without explanation.
2. Keep decision points binary when possible
A Yes/No or True/False logic at each decision node ensures clarity and precision. While not every decision is binary, reducing options at each point helps users follow the logic more easily. It also reduces the risk of branching chaos in complex scenarios.
3. Validate the flow with team members and stakeholders
Before finalizing, walk through the flowchart with others involved in the decision. This reveals logic gaps, hidden exceptions, or practical limitations that may not have been obvious during creation. A 15-minute review can prevent weeks of confusion later.
4. Use clear, concise labels
Every shape should be labeled with simple, direct language. Avoid jargon, acronyms, or overly technical terms, especially if the chart is meant for cross-functional or executive use. Think: “Budget Approved?” rather than “Proceed with CapEx sign-off.”
5. Make sure all paths lead to defined outcomes
A strong flowchart not only shows what to do but also where the process ends. Avoid loops that don’t terminate or branches that leave the user wondering, “What next?” Every decision path should have a conclusion or a handoff step.
Common Mistakes That Undermine Flowchart Quality
1. Overcomplicating with excessive detail
A flowchart should simplify, not replicate, a complex process. Including too many nested decisions, unnecessary visual elements, or rare exceptions can overwhelm the viewer. Focus on key decisions and keep deeper logic in supporting documentation, if needed.
2. Skipping rare but critical edge cases
Many flowcharts fail during real-world execution because they don’t account for “what-if” situations. Even low-probability scenarios, such as missing data, unavailable stakeholders, or conditional rework, deserve visual representation. Handling these upfront reduces firefighting later.
3. Not defining entry and exit points
Flowcharts without clearly defined starting and ending nodes can confuse users about how to enter or exit a decision process. Define what triggers the process and what constitutes a successful or failed outcome.
4. Inconsistent use of shapes, fonts, or connectors
Inconsistencies in visual style (e.g., using rectangles for both actions and decisions or varying connector arrows) make flowcharts appear unprofessional and difficult to follow. Stick to a style guide or template, especially when sharing externally.
Conclusion
Today, good decision-making isn’t just a skill; it’s a necessity. Decision flowcharts help project managers transform uncertainty into clarity by visually mapping out choices, outcomes, and action paths. Whether you’re managing stakeholder approvals, risk responses, or resource allocation, these tools bring structure and alignment to your process.
But tools alone aren’t enough. The real power lies in understanding how and when to use them and having the leadership capability to drive decisions that stick. That’s where Invensis Learning can support your growth. Through our globally recognized Project Management training programs, including PMP, PRINCE2, CAPM, and Agile certifications. We equip professionals with the frameworks, skills, and confidence needed to make informed decisions and thrive in complex project environments.
Start building smarter workflows and stronger leadership. Explore Invensis Learning’s Project Management courses today.


")


