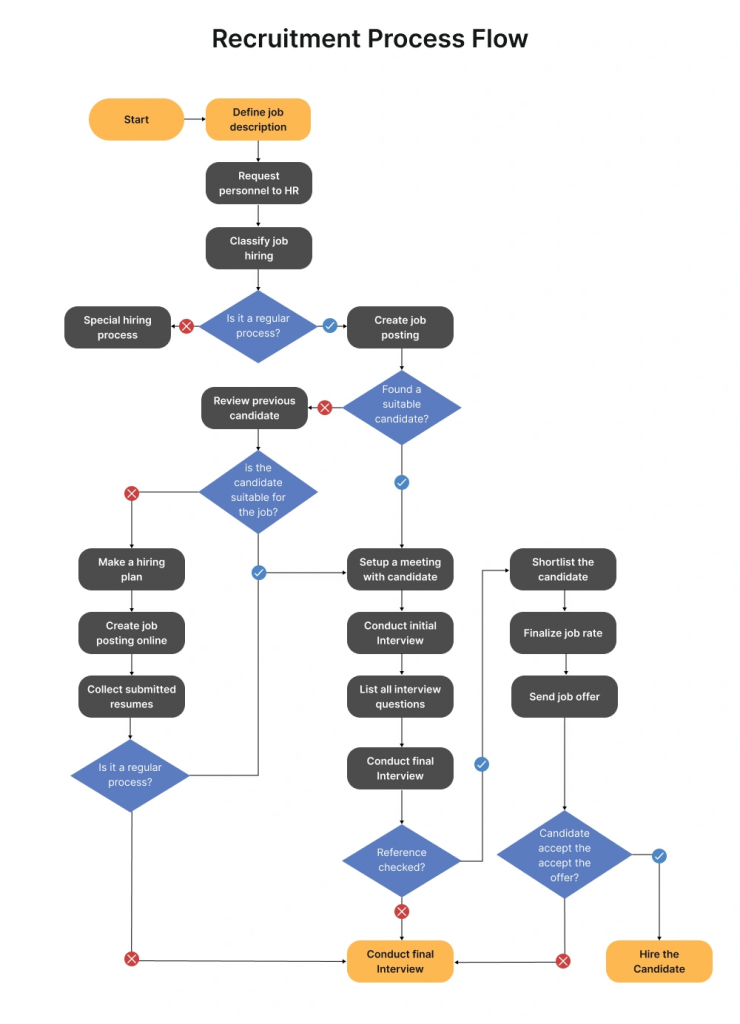
It’s hard to find a project manager who hasn’t sketched out a flowchart on a whiteboard, a napkin, or a digital canvas. From outlining timelines and task handoffs to mapping decision points and approval loops, flowcharts are often the first step in turning scattered ideas into structured execution. They help project managers simplify complex processes, make roles and responsibilities explicit, and surface points in the workflow where delays or confusion are likely to occur.
For most project managers, flowcharts emerge as a practical response to chaos when a process feels unclear, communication breaks down, or teams struggle to stay aligned. Instead of lengthy documents or scattered updates, a simple diagram can clearly show how work is supposed to flow, where decisions are made, and who is responsible for what. Whether you’re visualising a sprint workflow, a change control process, or a client onboarding journey, the right flowchart makes complexity visible and solvable.
That’s why it pays to know your flowcharts. Different types, like process diagrams, decision trees, swimlane charts, or data flow diagrams, each serve a specific purpose. When project managers understand which type fits which scenario, they can communicate more clearly, solve problems faster, and avoid reinventing the wheel. Whether you’re clarifying scope with stakeholders or guiding your team through a complex decision path, using the right diagram can turn vague discussions into confident execution.
In fact, Projects are 2.5 times more successful when strong project management practices, including visual tools like flowcharts, are applied.
In this guide, we’ll explore:
- The essential components and symbols every project manager should know
- The different types of flowcharts and how to use them in real project scenarios
- Practical, industry-relevant examples that bring each flowchart to life
- Best practices and common pitfalls to avoid when creating flowcharts
Whether you’re leading product development, managing client deliverables, or driving internal improvements, this guide will help you understand how different flowcharts work, and how to apply them, so you can communicate complex project workflows effectively.
What are Flowcharts?
A flowchart is a visual diagram that represents the steps, decisions, and flow of a process in a sequential manner. Using standardized symbols, such as rectangles for actions, diamonds for decisions, and arrows for direction, flowcharts break down complex procedures into easily understandable visuals.
In project environments where multiple teams, tools, and timelines converge, flowcharts help project managers create shared visibility. They make it easier to align stakeholders on process logic, clarify who does what and when, and reduce the risk of misinterpretation during execution. Especially in fast-paced or distributed teams, a simple flowchart can do what a long email thread or project brief often can’t, show the bigger picture at a glance.
What makes flowcharts especially valuable in project settings is their ability to create visual clarity across diverse audiences. They establish a shared language that bridges gaps between technical experts, business stakeholders, and team members from different functions. Whether you’re mapping onboarding workflows, illustrating change control processes, or designing approval chains, a clear flowchart ensures everyone sees how the work flows, and what’s expected at each step.
Understanding Flowchart Components
A flowchart is only as effective as the components it’s built with. Each symbol and connector plays a specific role in helping readers understand the sequence, logic, and structure of a process. By using standardized flowchart symbols, you create a visual language that is consistent, clear, and easy to interpret across teams and industries.
Basic Flowchart Symbols and Their Meanings
Here are the fundamental symbols used in most flowcharts:
- Start/End Points (Terminator)
Represented by an oval shape, this symbol marks the beginning or end of a process. It’s essential for clearly defining where the flow starts and stops.
- Process Steps
Shown as a rectangle, this symbol indicates an action, operation, or task that needs to be performed within the process.
- Decision Points
Depicted as a diamond, this symbol represents a decision that must be made, usually involving a Yes/No or True/False path that branches the flow.
- Input/Output
Represented by a parallelogram, this symbol indicates any data input into or output from a process, such as entering data or generating a report.
- Arrows and Connectors (Flowlines)
Arrows indicate the direction of the process flow, guiding the reader from one step to the next. They are critical for maintaining logical sequence.
Supporting Visual Elements
In addition to core symbols, supporting visual elements help improve clarity, organization, and readability:
- Annotations (Comments)
Represented by a bracketed or open-ended rectangle, annotations provide additional context, notes, or clarifications without cluttering the main flow of information.
- Directional Flow
Consistently placing arrows and maintaining left-to-right or top-down flow makes the chart easier to follow.
- Spacing and Alignment
Proper use of white space, even symbol sizing, and aligned connectors ensures a clean and professional appearance, which aids quick comprehension.
Types of Flowcharts
In project management, various flowchart types serve distinct purposes, ranging from mapping task flows and decision points to clarifying roles and identifying process gaps. They provide a structured way to visualize how work moves, where dependencies lie, and what inputs or approvals are required at each stage.
By selecting the appropriate flowchart type, project managers can streamline complex workflows, enhance team coordination, and facilitate clearer communication with stakeholders. Whether you’re planning a new project or optimizing an existing one, the right diagram makes it easier to align expectations, avoid delays, and ensure every step is accounted for.
In the sections that follow, we’ll explore the most useful flowchart types for project teams and when to apply each based on your project’s goals and context.
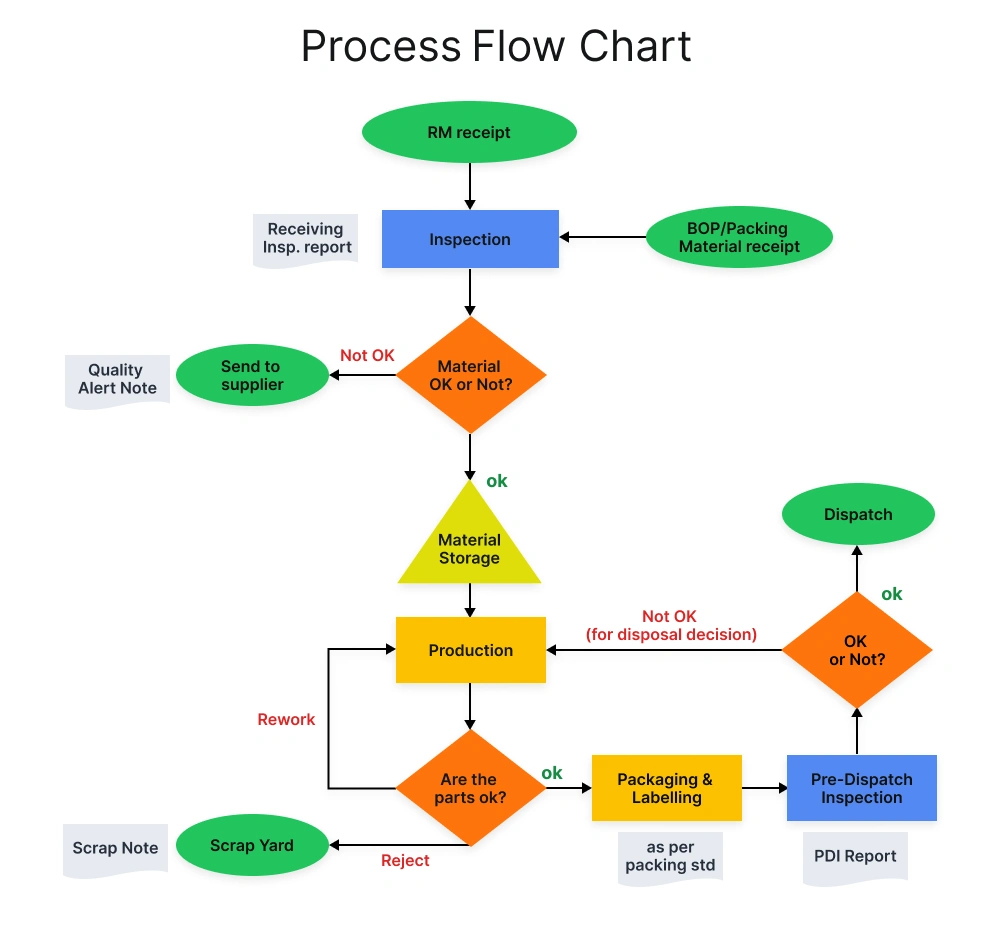
1. Process Flowcharts
For project managers, especially those juggling multiple teams or stakeholder groups, chaos often hides in the form of unclear workflows. Tasks are scattered across various tools, decisions are delayed, and dependencies often remain unspoken until they block progress. In such cases, a process flowchart isn’t just a neat diagram; it’s a blueprint for regaining control.
| Did You Know?
When 39% of project failures stem from a lack of planning, resources, or clear goals, tools like process flowcharts become critical, not optional, for managing clarity and execution across teams. |
By visually mapping the sequence of steps in a project workflow, process flowcharts give PMs a reliable way to translate abstract goals into tangible actions. Each step, decision point, and outcome is laid out clearly, helping the team see the full journey from trigger to delivery.
Revealing Gaps Before They Become Roadblocks
Project delays rarely stem from a single missed task; they usually originate from unspoken handoffs, misaligned expectations, or unnecessary loops. A process flowchart enables PMs to simulate the workflow before execution begins, making it easier to identify gaps, friction points, or over-engineered steps.
For example, during the planning phase of a client onboarding project, a PM may use a process flowchart to map every stage, from initial contract signing to first value delivery. What starts as a simple sketch often reveals missing steps, such as “approval routing” or “data validation,” which would otherwise emerge mid-project as blockers.
Supporting Cross-Team Execution
In projects involving operations, product development, design, and compliance, a shared understanding of how work gets done is often lacking. Flowcharts offer that clarity.
Instead of handing over a written process document, PMs can walk teams through a process flowchart that shows:
- When input is expected from each function,
- where decisions are made,
- and how dependencies flow.
This is especially useful in hybrid or remote environments, where a lack of face time increases the risk of miscommunication.
Beyond Kickoff: A Continuous Reference Point for Project Manageres
Unlike task trackers or sprint plans that often become outdated, process flowcharts remain relevant throughout the entire project lifecycle. They’re referenced during retrospectives to understand what went wrong. They’re updated mid-project to reflect pivoted scopes. They’re used in stakeholder reviews to justify changes in timelines or responsibilities.
Take a software development lifecycle (SDLC) project. A flowchart showing the phases from ideation to deployment helps new joiners grasp the flow in minutes. It also helps the PM explain process changes, such as shifting from a waterfall to an agile approach, to leadership without having to wade through 20 slides.
Case Study: Process Flowcharts in BIM Project ManagementIn a real-world application, the Airos Building project demonstrated how process flowcharts, when integrated with BIM methodology, can significantly improve project coordination, reduce errors, and enhance lifecycle planning. By mapping workflows across architecture, structure, and MEP disciplines, the project team visualized every phase using collaborative flowcharts. This included steps for 4D planning, 5D cost estimation, interference detection, and documentation delivery, all aligned under a shared digital model (CDE). The result: Faster decision-making, clearer role accountability, and fewer design clashes. Flowcharts weren’t just diagrams; they became strategic tools for orchestrating cross-disciplinary execution in complex, multi-phase construction projects. This case demonstrates how project managers can utilize process flowcharts not only to plan but also to synchronize execution across digital environments, particularly in BIM-driven initiatives. |
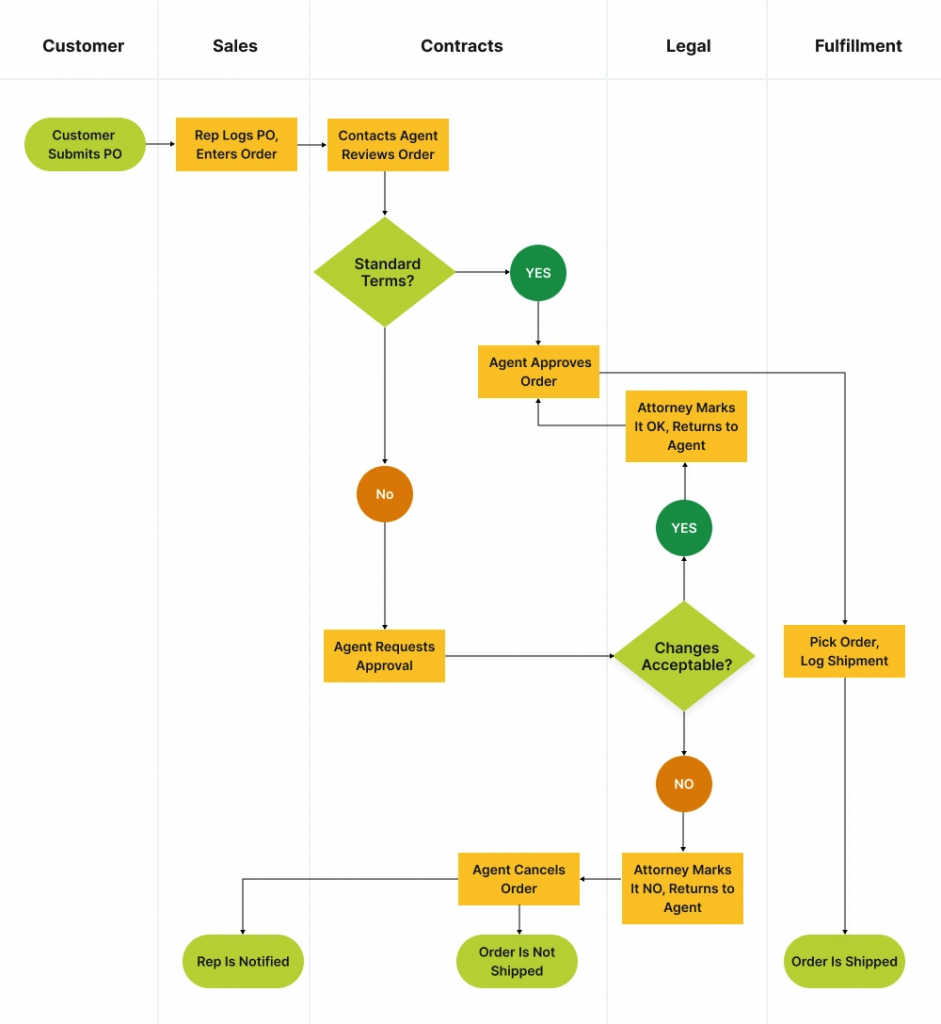
2. Swimlane / Cross-Functional Flowchart
If you’ve ever run a project where Legal, Marketing, and IT all had to approve something, but no one was quite sure who was up next, you’ve already lived the problem that Swimlane Flowcharts are designed to solve.
These diagrams bring order to complexity by grouping activities by role, team, or department. Each “lane” in the flowchart visually separates who is responsible for what, so you’re not just tracking the sequence of tasks; you’re tracking ownership. That distinction becomes critical when accountability is distributed but outcomes are collective.
Projects Aren’t Linear, But Accountability Should Be
One of the most common failure points in cross-functional projects is the dreaded “handoff gap.” Tasks get completed, but no one knows who owns the next move. Swimlane flowcharts eliminate this ambiguity by making every handoff explicit. This is especially valuable in:
- Approval chains involving multiple departments
- Customer journeys that cross operational silos
- Implementation plans with technical and business dependencies
Let’s say you’re rolling out a new internal tool. The product team designs it, IT configures access, HR launches internal training, and Compliance signs off on data handling. A swimlane chart makes sure none of those steps happen in isolation, and that every team understands both what they own and who they’re waiting on.
When Project Managers Turn to Swimlanes?
- During project planning, to align different departments on responsibilities
- In process improvement workshops, where gaps in handoffs are uncovered
- For stakeholder presentations, to show clarity of roles and reduce friction
- When managing remote or hybrid teams, where informal coordination is limited
While swimlane flowcharts may look neat, their real value lies in how they support operational discipline. They become onboarding tools, audit artifacts, and collaborative maps all at once. For PMs, they serve as a way to avoid costly delays caused by unclear role boundaries and missed dependencies.
And perhaps most importantly, they help teams shift from “I thought they were handling it” to “Here’s exactly who does what, when, and why.”
Real-World Case Study: Swimlane Flowcharts in HealthcareA notable application of Swimlane flowcharts comes from a healthcare case where a cancer patient received double the intended radiation dose due to a series of calculation and communication errors. The treatment process involved multiple radiographers and a physicist, each responsible for key steps from dose calculation to system verification. Despite having protocols such as independent checks and automated alerts, the error went unnoticed due to flawed manual calculations and missed opportunities for cross-verification. Using a Swimlane diagram, investigators mapped out each individual’s role and actions, revealing:
This visualization helped identify process gaps and suggested improvements for safety, training, and system design. Key takeaway: Swimlane flowcharts are powerful tools for highlighting breakdowns in multi-role processes, whether in healthcare or any cross-functional business workflow. |
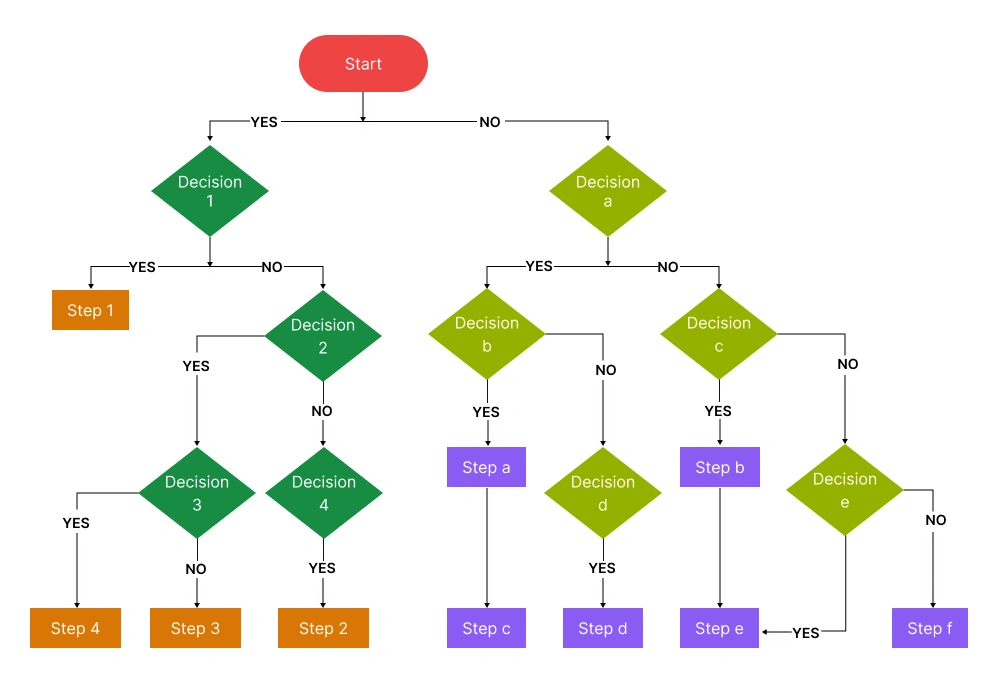
3. Decision Tree Flowchart
Some decisions are binary. Others? They branch like wildfire.
For project managers navigating layered, high-stakes choices, where each decision opens a new set of conditions, decision tree flowcharts become indispensable.
Whether you’re selecting a vendor, prioritising product features, or handling stakeholder objections, a decision tree doesn’t just show what to decide; it visualizes how the logic unfolds across possibilities, trade-offs, and outcomes.
Project Planning Meets Logic Mapping
One of the most powerful applications of decision trees in project management is during early-stage strategic planning. When goals are clear but the path is unclear, these flowcharts serve as a GPS for your options.
For instance, in a go/no-go product release scenario, a PM might map out conditions like market readiness, regulatory impact, internal resource bandwidth, and customer feedback scores. Each “yes” or “no” branch leads to the next checkpoint until a confident, data-informed decision is reached.
This transforms an overwhelming decision into a manageable, traceable process, rather than just an executive hunch.
Reducing Risk Through Scenario Thinking
In risk analysis and contingency planning, decision trees help PMs walk the path before the team walks it. If launching a project in a volatile market, for example, you can map economic triggers, compliance outcomes, and alternative routes (such as delay, scale down, or pivot). This allows leadership to prepare responses, not just react.
It’s a mental rehearsal, made visual.
Where PMs Use Decision Tree Most?
- Change Requests: Evaluating impact based on scope, cost, and schedule
- Prioritization Frameworks: Mapping decision paths for backlog refinement
- Budget Choices: Trade-off modeling across departments or quarters
- User Experience Design: Defining support flows, onboarding logic, or escalation steps
- Policy Enforcement: HR and compliance decisions that depend on multi-variable conditions
Less Back-and-Forth, More Shared Clarity
Decision trees serve another important function, often overlooked by PMs: they foster decision alignment across teams. With the logic visible, there’s less room for debate, second-guessing, or misinterpretation. Everyone knows how and why a choice was made.
That’s especially useful when decisions are revisited during retrospectives or audits. You don’t just remember the outcome, you remember the reasoning.
Not Just for Decision-Making, but For Building Confidence in the Process
When teams feel a decision was made systematically, they’re more likely to support it. And when you can show stakeholders a logic-based decision tree tied to their priorities, you earn buy-in faster.
While the name suggests “decision,” what you’re building is trust, clarity, and momentum.
Using Decision Trees to Evaluate Project Options Under UncertaintyIn a real-world mining project scenario, a project manager faced a tough mid-project decision: after discovering regulatory changes, the team had to choose a wastewater treatment system without derailing the nearly-complete mine schedule. Three options were on the table: buying a used plant, purchasing a new skid-mounted system, or installing a fixed unit. Each had trade-offs in terms of cost, installation speed, and operational risk. But the real complexity emerged from two major uncertainties:
Each alternative carried different probabilities for delays, which would impact revenue due to postponed operations. To handle this, the team used a decision tree to visualize and calculate the total expected cost of each path, including acquisition, monthly operating costs, salvage value, and the cost of schedule delay. Key takeaway: By mapping out the sequence of decisions and risks and attaching probabilities to installation timelines, the team can estimate the expected value costs for each option. The result? The skid-mounted plant, while not the cheapest upfront, offered the best overall value when time, uncertainty, and long-term costs were factored in. This was revealed through the decision tree’s ability to combine all variables – time, performance, and financials , into a single, structured analysis. This case illustrates how decision tree analysis helps project managers move beyond instinct, particularly when facing complex trade-offs among speed, cost, and risk. |
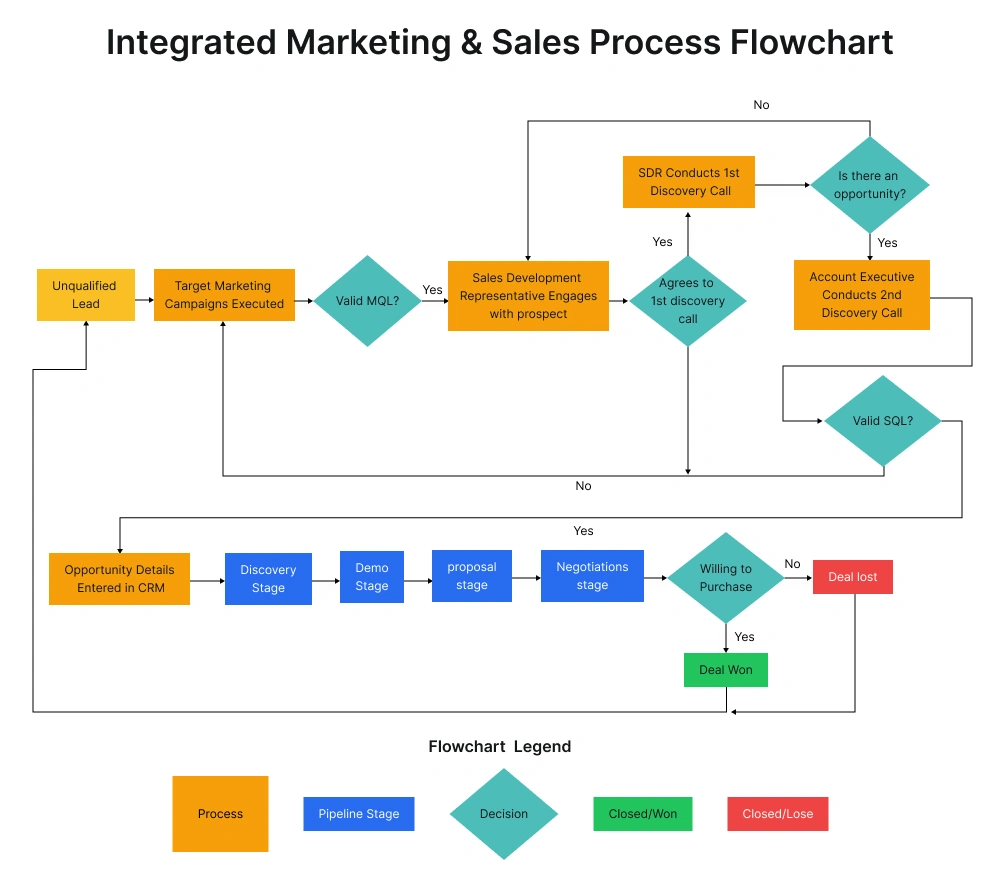
4. Workflow Diagrams
Project managers are often tasked with delivering outcomes, but they rarely get a detailed map of how the work gets done. That’s where workflow diagrams step in, not to show what needs to be achieved, but how the work flows to get there.
| Did You Know?
According to a study by McKinsey, employees spend up to 20% of their time searching for internal information, much of which can be reduced through clear process visuals and workflow mapping. |
These diagrams don’t just outline steps, they expose the mechanics behind team operations: who’s involved, what comes next, and where things get stuck. For PMs managing end-to-end delivery or process-heavy initiatives, workflow diagrams become an essential planning and alignment tool.
From “Who’s Doing What?” to “Here’s the Path”
Midway through a project, confusion usually doesn’t stem from unclear goals; it comes from ambiguity surrounding execution. Who initiates the task? Where does it get approved? What happens if the handoff is delayed?
A well-built workflow diagram eliminates the guesswork. By mapping the exact process, task by task, across roles and systems, the project manager can detect dependencies, assign ownership, and visualize handoffs proactively. This is especially useful when managing large operational rollouts, onboarding flows, or creative production cycles.
In Practice: How PMs Use Workflow Diagrams?
Rather than using them as static documentation, effective PMs treat workflow diagrams as living project blueprints. They use them to:
- Validate process readiness before execution
- Train new team members without heavy SOPs
- Optimize approval timelines or resource allocation
- Implement workflow automation in tools like Jira, Notion, Power Automate
- Document processes for audits or ISO compliance
In cross-functional settings, such as DevOps, HR, or marketing operations, these diagrams also become the go-to visual during kickoff meetings or retrospectives. They make conversations tangible.
What Makes Workflow Diagrams Different for Project Managers?
Unlike higher-level flowcharts or strategy maps, workflow diagrams zoom into execution-level granularity. They map how things move, not just why they exist. This makes them especially valuable in:
- Fast-scaling environments with changing team structures
- Compliance-heavy projects needing clear handoffs
- Operational audits or standardization initiatives
- Collaborative delivery models across time zones
Ultimately, project managers use workflow diagrams not just to draw a map, but to facilitate a smoother journey. It’s not about the lines and boxes. It’s about what they help teams see before the project ever hits friction.
5. System Flowcharts
Not every project manager needs to write code or configure servers, but many are expected to deliver results that rely heavily on how those systems work. That’s where system flowcharts become essential, not just for the technical team, but for the PM trying to manage delivery, integration, and stakeholder expectations.
System flowcharts visualise how inputs, logic, data flows, and outputs interact within a system, across both software and hardware layers. For a project manager, this isn’t about technical detail; it’s about understanding the system logic well enough to identify dependencies, estimate effort, and prevent surprises.
| Did You Know?
In a PMI Pulse of the Profession report, 37% of project failures were attributed to poor requirements gathering and system integration breakdowns. |
Where Project Managers Use System Flowcharts
- In planning system integration, when coordinating between vendors, platforms, or internal tech teams, a system flowchart clarifies the connections between components, reducing assumptions and improving handoff quality.
- During requirement sign-offs, PMs use these flowcharts to validate workflows across departments (e.g., sales system – ERP – finance), ensuring that all functional gaps are identified early.
- In risk identification, system flowcharts help identify potential failure points, such as redundant API calls, manual bottlenecks, or fragile data dependencies, that could derail the schedule or impact compliance.
- For cross-functional communication: Not every stakeholder reads code or specs. A system flowchart gives everyone, from legal to customer success, a shared language to understand how the solution works.
Why It’s a Strategic Tool for PMs?
System flowcharts aren’t just technical documents. They serve as:
- A roadmap for aligning functional and technical teams
- A reference point for testing, QA, and vendor SLAs
- A compliance artifact in regulated industries
- A risk control tool during deployment planning
You don’t need to build the system, but you do need to understand how it works. System flowcharts help you manage what you’re accountable for: delivery, dependencies, and cross-team clarity.
6. Data Flow Diagrams (DFD)
For project managers leading complex initiatives, especially those involving digital systems, integrations, or compliance, one of the biggest risks is not knowing how data moves behind the scenes. Everyone understands the tasks. But what happens to the information between those tasks? That’s where Data Flow Diagrams (DFDs) come in.
Unlike typical process charts that show sequences or roles, DFDs are all about flow, of information, not effort. They map how data enters, travels, gets transformed, and exits a system. It’s not about who does it or when, it’s about where data lives and how it moves.
Why PMs Use DFDs?
Often, DFDs come into play before anyone labels them. A PM walks into a planning session and starts whiteboarding:
- “Customer fills form – info goes to CRM – triggers onboarding email – API call to billing…”
- Congratulations, that’s already a Level 0 DFD.
But refining it into an actual data flow diagram brings clarity and structure, especially when multiple systems, vendors, or teams are involved.
PMs use DFDs to:
- Clarify how systems connect without needing technical jargon
- Catch assumptions or oversights early (e.g., ‘Where’s the data stored?’)
- Translate business requirements into development-ready logic
- Ensure data compliance and audit traceability in sensitive workflows
A Project Moment Where It Makes All the Difference
During the redesign of a digital loan approval system, a PM was coordinating between frontend UX designers, backend developers, and a third-party credit scoring service. Everything seemed mapped, until a Level 1 DFD exposed a broken path: the application data was validated, but never stored before being sent to the credit API.
That minor error would have resulted in data loss if the API had failed. Because the team caught it in a DFD review, they resolved it before development even began.
This is where DFDs shine, not just in planning, but in preventing silent failures downstream.
Not Just for Analysts: Why PMs Should Care
- You don’t need to build the database, but you do need to ensure the right data reaches it.
- You don’t write API code, but you’re the one answerable when two systems don’t talk.
- You don’t manage security, but when the auditor asks, “Where is personal data stored?”, you’ll wish you had a DFD.
DFDs provide project managers with a powerful lens to see what is usually hidden, and manage systems with the kind of confidence that earns trust from both tech teams and stakeholders.
How to Choose the Right Flowchart for Your Project?
With so many types of flowcharts available, picking the right one isn’t just a technical decision; it’s a leadership decision. For project managers, the diagram you choose can either enhance clarity among stakeholders or further complicate the process.
Here’s how to make that call with confidence.
1. What’s Your Project Objective?
Start by clarifying what you’re trying to achieve with the visual.
- To clarify handoffs and ownership across teams: Go for a swimlane flowchart.
- To map task sequences or SOPs: A workflow diagram brings step-by-step clarity.
- To weigh scenarios or risks: A decision tree is your strategic thinking aid.
- To visualize data architecture or system design: Consider a DFD or system flowchart.
2. Who Are You Presenting It To?
Your audience determines your format more than the process itself.
- For senior stakeholders or clients: Use high-level diagrams that emphasize clarity over depth.
- For cross-functional teams: Swimlane or workflow diagrams make roles and dependencies obvious.
- For developers or system integrators, use DFDs or system flowcharts to illustrate data flow and logic.
- For onboarding new team members: Visual SOPs or workflow diagrams are ideal.
3. How Complex Is the Workflow?
Avoid over-engineering for simple tasks, or underrepresenting complex decisions.
- For linear or routine processes: Stick to workflow charts.
- For projects with conditional logic or what-if scenarios: Use decision trees or algorithm charts.
- For projects involving multiple data sources or backend systems, use DFDs or system flowcharts.
4. Are You Working in a Regulated Environment?
Certain industries require more than just visual clarity; they demand traceability, auditability, and documentation that is compliant with regulations.
- In regulated sectors such as finance, healthcare, or logistics, use documented process charts with standard notations.
- For compliance walkthroughs or security reviews: Swimlane and document flowcharts clarify responsibilities and approvals.
- Sharing with auditors or third parties: Stick to standardised symbols and notation conventions.
Flowchart Selection Matrix
Here’s a quick guide to help you decide which flowchart fits your use case:
| Use Case / Scenario | Recommended Flowchart Type |
| Process automation and task standardization | Workflow Diagram |
| Step-by-step documentation for compliance | Document Flowchart |
| Visualizing roles across departments | Swimlane Flowchart |
| Evaluating business strategies or risk paths | Decision Tree Diagram |
| Logical troubleshooting or algorithm planning | Algorithm Flowchart |
| System architecture and IT infrastructure | System Flowchart |
| Tracking data movement and integration logic | Data Flow Diagram (DFD) |
| Project workflows in cross-functional teams | Workflow Diagram / Swimlane Chart |
| Regulatory documentation trails | Document Flowchart |
| Technical audience analysis | System Flowchart / DFD |
| Simplifying complex decision paths | Decision Tree / Algorithm Chart |
| Explaining logic to non-technical users | Algorithm Flowchart |
| Internal process visualization (HR, Finance) | Workflow / Document Flowchart |
| Approval flows and sign-off tracking | Document Flowchart |
| Incident analysis and gap detection | Swimlane Flowchart |
| Repetitive support or onboarding processes | Decision Flowchart / Workflow |
Best Practices for Project Managers to Create Flowcharts That Drive Execution
For project managers, flowcharts are more than visual aids; they are strategic alignment tools. Whether you’re leading a product build, orchestrating a cross-functional rollout, or managing vendor handoffs, the way you structure a flowchart can determine how your team sees the path ahead.
A poorly designed flowchart creates confusion. A well-designed one becomes the blueprint for decisive action.
1. Clarify Before You Simplify: Know the Flow’s Purpose
Start by defining the intent of the flowchart. Is it for internal coordination or stakeholder reporting? Process redesign?
If it’s for quick team reference, focus on clarity and task flow. If it’s for executive updates, compress the flow into strategic stages. The design of your flowchart must reflect the level of granularity required by its audience.
| Project leadership tip: Don’t simplify prematurely. First, clarify the logic, then eliminate what is unnecessary. Simplification without clarity leads to oversights in task responsibility or risk identification. |
2. Use Visual Logic, Not Just Symbols
While symbol consistency is important, what matters is visual logic, how one process flows into the next, and how decisions are interpreted.
- Always follow top-to-bottom or left-to-right flow unless there’s a reason to do otherwise.
- Group related activities into clear segments (e.g., initiation, execution, closure) to create functional blocks that mirror the project lifecycle.
- Decision nodes should not create ambiguity. If more than two branches emerge, consider whether you’re dealing with a compound decision that should be split.
For project managers, a well-routed flowchart becomes a shared decision map. It prevents rework and ensures that downstream teams understand why a process is structured in a particular way.
3. Break Complex Projects Into Modular Diagrams
Large-scale projects often involve multi-threaded processes, including procurement, development, compliance, and vendor integration. Don’t cram everything into a single massive diagram.
Instead:
- Create modular flowcharts for each major process.
- Use parent-child hierarchy; your main chart links to subprocess charts.
- Keep visual consistency across all diagrams to support stakeholder walkthroughs.
A modular approach ensures clarity at both the macro and micro levels. It’s especially useful during phased planning or when onboarding new team members midway through the project.
4. Make It Review-Ready, Not Just Team-Usable
Many PMs create flowcharts only for their internal teams, but these visuals often make their way into stakeholder decks, audit trails, or client reports.
To make your chart review-ready:
- Use clear labels, legible fonts, and generous white space.
- Avoid overlapping connectors or color-coded confusion.
- Include a title, version number, and date, especially if it’s a living document subject to revision.
A flowchart that can’t be understood in a 10-minute review meeting won’t help the project. It must withstand scrutiny and help clarify scope, decisions, and dependencies.
5. Choose the Right Tools for the Right Moment
Not every chart needs an enterprise-grade tool. The choice depends on the maturity of your process and collaboration needs.
| Tool | Use Case |
| Lucidchart | Best for collaborative process mapping with versioning and integrations. |
| Miro | Useful during early project stages—mapping agile workflows, retrospectives, ideation. |
| Draw.io | Lightweight and ideal for quick, tactical visuals. |
| Visio | Recommended for large-scale programs with compliance or audit requirements. |
Conclusion
In the hands of a project manager, flowcharts become more than diagrams; they become strategic instruments for clarity, control, and collaboration. Whether you’re managing stakeholder approvals, cross-functional handoffs, or data-heavy system flows, the right flowchart helps break down complexity and align teams around shared understanding.
Don’t wait for bottlenecks to appear; address them promptly. Start by charting processes that are repeated, delayed, or misunderstood. As you grow more fluent in visual mapping, you’ll notice faster decision-making, fewer handoff issues, and stronger team alignment across the board.
To strengthen this capability, consider enrolling in Invensis Learning’s Project Management programs, where tools like flowcharts are taught alongside real-world planning, execution, and communication practices essential to modern project success.


