
Project schedules rarely follow a straight line. Tasks depend on each other, timelines shift, and uncertainty makes planning difficult. That is where PERT in project management becomes useful.
PERT (Program Evaluation and Review Technique) is a project management tool used to plan, schedule, and analyze tasks when activity durations are uncertain. Instead of relying on a single estimate, PERT uses multiple time estimates to create more realistic project timelines and identify the critical path.
In this guide, you will learn what PERT is, how it works, how to create a PERT chart, and how PERT analysis helps improve project planning accuracy.
What Is PERT in Project Management?
PERT in project management is a scheduling technique used to estimate project duration by analyzing task dependencies and accounting for uncertainty using three time estimates.
Unlike traditional planning methods that assume fixed timelines, PERT evaluates projects using:
- Optimistic Time (O): The shortest possible duration.
- Most likely Time (M): The expected duration under normal conditions.
- Pessimistic Time (P): The longest possible duration.
Using these estimates, PERT calculates expected task durations and maps them in a PERT network, helping project managers identify the critical path, potential delays, and overall project timeline.
PERT is widely used in complex, time-sensitive projects such as product development, engineering, research, and large-scale IT implementations, where uncertainty and interdependencies significantly impact delivery timelines.
What Does PERT Chart Contain?
A PERT chart is a visual project management tool used to represent tasks, timelines, and dependencies in a project.
It displays the sequence of activities using a network diagram, where tasks are connected based on their order of execution. Unlike a simple timeline, a PERT chart focuses on task relationships, dependencies, and flow, rather than just start and end dates.
Each activity in a PERT chart is linked to others, helping project managers understand:
- Which tasks must be completed before others can begin?
- How delays in one activity impact the overall project.
- The sequence of tasks that determines the total project duration.
In short, a PERT chart helps visualize how a project actually unfolds, not just when tasks happen.
What Is a PERT Network?
A PERT network is the underlying structure of a PERT chart that shows how all project activities are connected.
It is built using:
- Nodes (Events or Milestones): Represent the start or completion of tasks.
- Arrows (Activities): Represent the tasks themselves.
- Dependencies: Define the order in which tasks must be performed.
Together, these elements form a network diagram that maps the entire project flow from start to finish. Within a PERT network, project managers can identify:
- The critical path (longest sequence of dependent tasks).
- Parallel activities can run simultaneously.
- Slack time available without delaying the project.
This network-based approach is what makes PERT different from basic scheduling tools; it allows teams to analyze complexity rather than just track timelines.
PERT Analysis: How Time Estimation Works

PERT analysis is the process of estimating project duration by using multiple time estimates for each task, rather than relying on a single fixed value.
Unlike traditional scheduling methods, PERT accounts for uncertainty by evaluating how long a task could, should, and might take under different conditions. This makes it especially useful for projects with unpredictable timelines.
The Three Time Estimates in PERT
- Optimistic Time (O): The shortest time required if everything goes perfectly
- Most Likely Time (M): The expected duration under normal working conditions
- Pessimistic Time (P): The longest time if delays or issues occur
Instead of guessing a single number, PERT combines these estimates to reduce risk in planning.
PERT Formula for Expected Time
TE = (O + 4M + P) / 6
O = Optimistic, M = Most Likely, P = Pessimistic
Using this formula, project managers calculate the expected time (TE) for each activity.
How PERT Analysis Improves Project Planning?
PERT analysis does more than just estimate time; it helps teams make better decisions by:
- Identifying high-risk tasks where uncertainty is high.
- Improving scheduling accuracy by factoring variability.
- Supporting critical path analysis to find the longest sequence of tasks.
- Enabling better resource planning based on realistic timelines.
|
Expert Perspective “PERT is less about producing a perfect schedule and more about understanding how a project behaves under uncertainty. ‘Plans are useless, but planning is indispensable.’ PERT supports this by helping teams evaluate different scenarios and prepare for variability.” |
 |
By combining probabilistic estimation with dependency mapping, PERT provides a deeper understanding of how delays can affect the project's overall schedule.
PERT Formula With Example (Step-by-Step Calculation)
To understand how PERT in project management works, let’s look at a simple example with task estimates and calculate the expected duration.
Step 1: Define Project Tasks and Time Estimates
Assume a small project with three tasks:
TaskOptimistic (O)
Most Likely (M)
Pessimistic (P)
A 2 days 4 days 6 days
B 3 days 5 days 9 days C 1 day 2 days 3 days
Step 2: Apply the PERT Formula
TE = (O + 4M + P) / 6
O = Optimistic
M = Most Likely
P = Pessimistic
Now calculate the expected time for each task:
- Task A [symbol]rarr[/symbol] (2 + 4×4 + 6) / 6 = 4 days
- Task B [symbol]rarr[/symbol] (3 + 4×5 + 9) / 6 = 5.33 days
- Task C [symbol]rarr[/symbol] (1 + 4×2 + 3) / 6 = 2 days
Step 3: Identify Task Sequence
Assume:
- Task A [symbol]rarr[/symbol] Task B [symbol]rarr[/symbol] Task C (sequential flow)
Step 4: Calculate Total Project Duration
Total expected duration:
4 + 5.33 + 2 = 11.33 days
This sequence represents the critical path, since all tasks are dependent on one another and determine the total project timeline.
How to Create a PERT Chart? (Step-by-Step)
Creating a PERT chart in project management involves mapping tasks, estimating durations, and identifying dependencies to build a clear project workflow.
Follow these steps to build an effective PERT chart:
Step 1: Identify All Project Tasks
Start by listing every activity required to complete the project. Focus on:
- Deliverables and milestones
- Major tasks (not micro-level details)
- Logical grouping of activities
A complete task list ensures nothing is missed when building the PERT network.
Step 2: Define Task Dependencies
Determine the order in which tasks must be performed. Ask:
- Which tasks must be completed before others start?
- Which activities can run in parallel?
This step establishes the flow of the PERT network.
Step 3: Estimate Time for Each Task
Assign three time estimates for every activity:
- Optimistic (O)
- Most Likely (M)
- Pessimistic (P)
Then calculate the expected time using the PERT formula.
This is where PERT analysis comes into play.
Step 4: Draw the PERT Network Diagram
Now visualize the project:
- Use nodes to represent milestones/events.
- Use arrows to represent tasks.
- Connect tasks based on dependencies.
This creates the PERT chart (network diagram).
Step 5: Identify the Critical Path
Analyze the network to find:
- The longest sequence of dependent tasks.
- The path that determines total project duration.
Any delay in this path directly delays the project.
Step 6: Monitor and Update the Chart
PERT is not a one-time activity.
- Update estimates as the project progresses.
- Adjust dependencies if needed.
- Recalculate timelines when delays occur.
This keeps the project plan realistic and adaptable.
When to Use a PERT Chart?
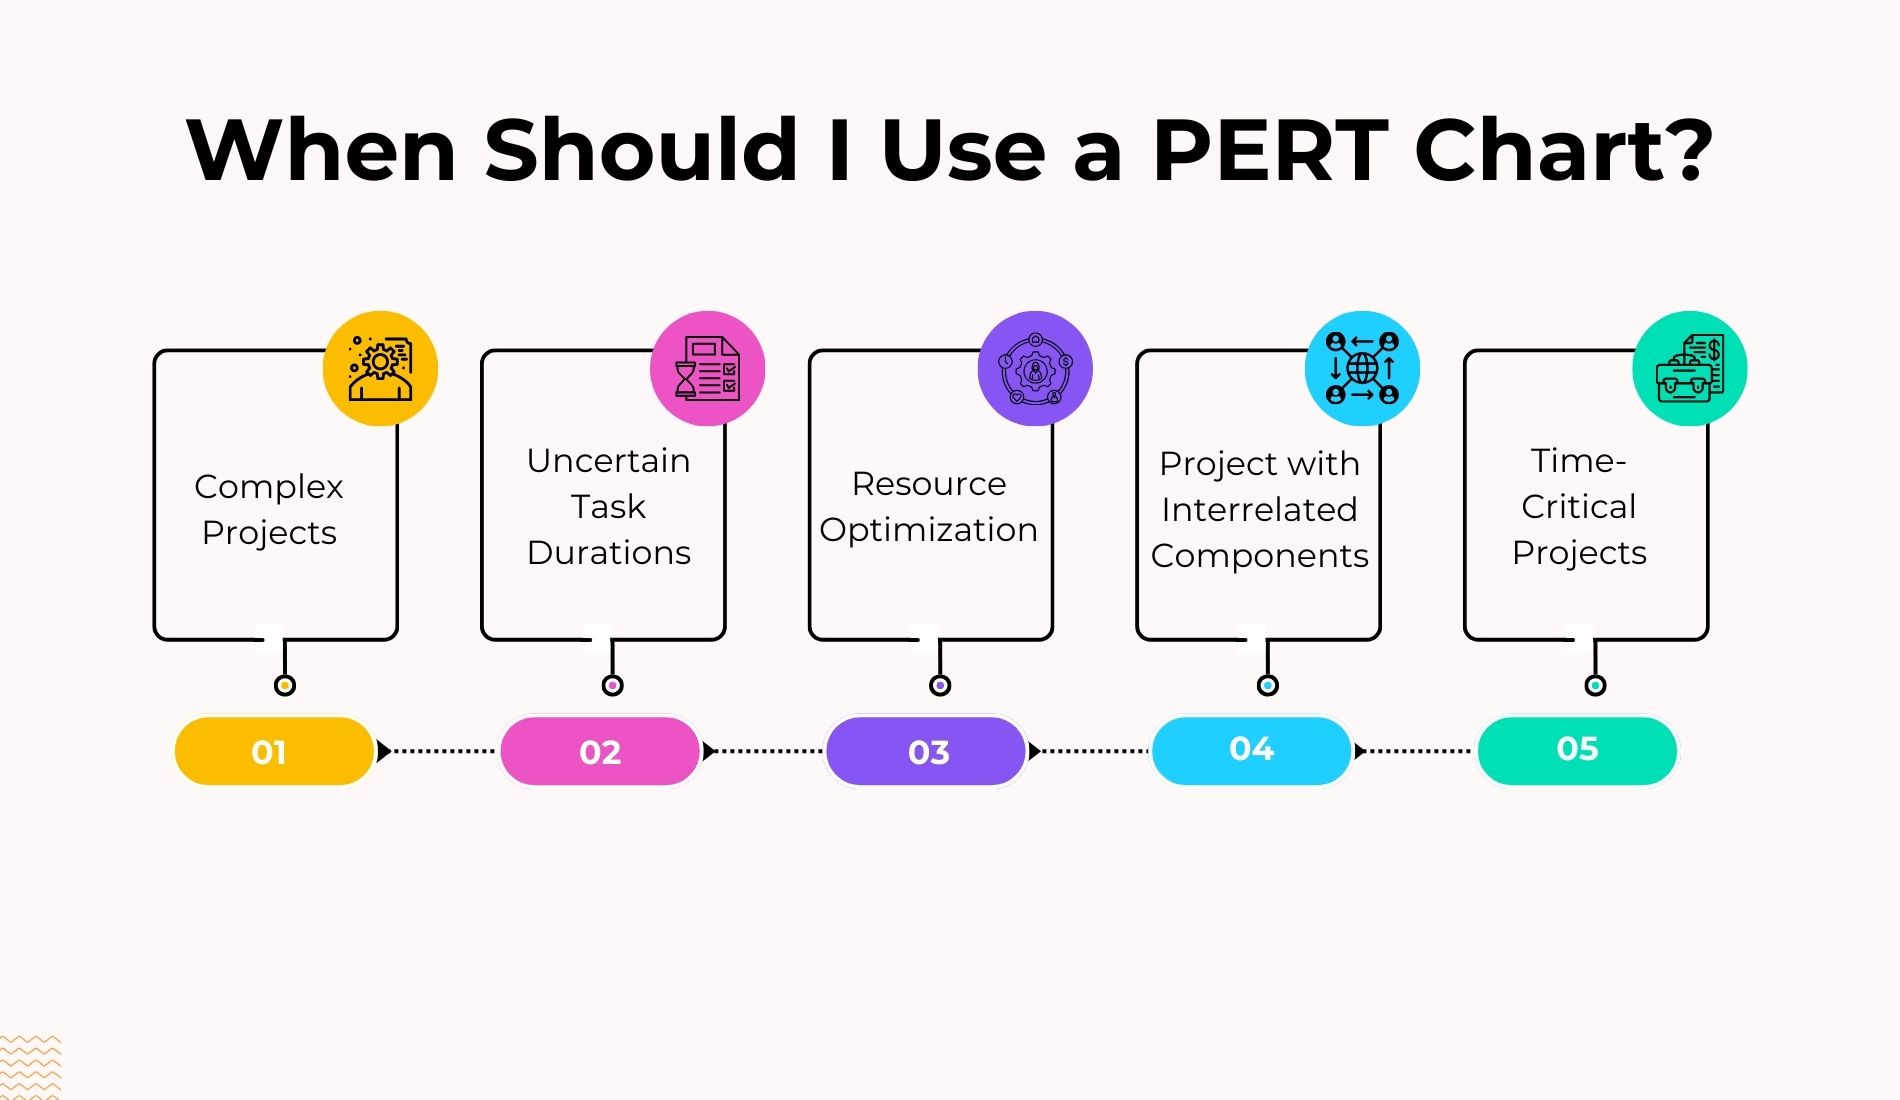
A PERT chart is beneficial in specific project management scenarios where complex tasks and uncertainties necessitate a detailed and visual approach to planning. Here are situations when it is advisable to use a PERT chart:
1. Complex Projects
PERT charts are particularly effective for complex projects with many tasks and intricate interdependencies. The visual representation helps project managers and teams understand the project's structure and complexities.
2. Uncertain Task Durations
PERT's probabilistic approach proves invaluable when task durations are uncertain or variable. Incorporating optimistic, most likely, and pessimistic time estimates provides a more realistic view of project timelines, considering various scenarios.
3. Resource Optimization
When optimizing resource allocation is critical, PERT charts come into play. Identifying critical paths and tasks with zero floats allows for better resource utilization and prevents potential bottlenecks, contributing to overall project efficiency.
4. Project with Interrelated Components
PERT charts are well-suited for projects with interconnected components. By illustrating how changes or delays in one area impact the project timeline, they provide a comprehensive view that aids in strategic decision-making and risk management.
5. Time-Critical Projects
In projects with strict deadlines and time constraints, PERT is indispensable. Identifying critical paths and potential areas for optimization ensures efficient time management and enables proactive decision-making to meet project deadlines.
How to Make a PERT Chart?

Creating a PERT chart is a structured process crucial for visualizing project timelines, dependencies, and critical paths. This step-by-step guide outlines the key actions to construct a PERT chart efficiently, ensuring project managers can effectively plan, manage resources, and navigate the complexities of intricate project landscapes.
1. Identify Activities
Begin by identifying and listing all the activities or tasks involved in the project. These activities should be specific and clearly defined, encompassing the entire scope of the project.
2. Determine Dependencies
Establish the relationships and dependencies between the identified activities. Identify which tasks must be finished before others can start, ensuring a logical sequence for the project workflow.
3.Create the PERT Chart
Develop the visual representation of the project using a PERT chart. Draw nodes to represent each activity and connect them with arrows to indicate task sequences based on the determined dependencies.
4. Assign Time Estimates
Assign time estimates to each activity, considering three scenarios: optimistic time (O), most likely time (M), and pessimistic time (P). These estimates provide a range of possible durations for each task.
Project managers can use the PERT formula to determine work length based on various time estimations.
E = (O + (4 × M) + P) / 6
In this formula:
- Optimistic Time (O) is the best-case scenario for the time required to complete the activity
- Most Likely Time (M)Most Likely Time (M) is the most realistic estimate of the time required for task completion under normal conditions
- Pessimistic Time (P)Pessimistic Time (P) is the worst-case scenario for the time required to complete the activity
Let's consider an example to illustrate the use of the PERT formula:
Suppose you have an activity with the following time estimates:
- Optimistic Time (O): 4 days
- Most Likely Time (M): 7 days
- Pessimistic Time (P): 10 days
Using the PERT formula:
E = (O + (4 × M) + P) / 6
E = (4 + (4 × 7) + 10) / 6
So, E = 7 Days
5. Define the Critical Path
Determine the critical path, which is the longest sequence of tasks, determining the minimum project duration. Calculate the expected time for each activity and determine which tasks lie on this critical path. The critical path tasks have no float or slack.
6. Track Progress
Continuously monitor and track the progress of activities against the PERT chart. Update the chart as tasks are completed or if there are changes in project circumstances. This ongoing tracking ensures that the project stays on course and deviations can be addressed promptly.
PERT Chart Example
To understand how PERT works in practice, consider a simple product launch project.
Project Scenario: New Product Launch
A company is preparing to launch a new product. The project involves multiple dependent activities that must be completed in sequence.
Step 1: Define Tasks and Dependencies
| Task | Activity | Dependency |
| A | Market Research | — |
| B | Product Design | A |
| C | Prototype Development | B |
| D | Testing | C |
| E | Marketing Campaign Setup | B |
| F | Product Launch | D, E |
Step 2: Assign Time Estimates (O, M, P)
| Task | O (days) | M (days) | P (days) |
| A | 3 | 5 | 7 |
| B | 4 | 6 | 10 |
| C | 5 | 8 | 12 |
| D | 3 | 4 | 6 |
| E | 2 | 3 | 5 |
| F | 1 | 2 | 3 |
Step 3: Calculate Expected Time
Using the PERT formula:
TE = (O + 4M + P) / 6
Where:
O = Optimistic
M = Most likely
P = Pessimistic
Calculated values:
- A = 5 days
- B = 6.67 days
- C = 8.17 days
- D = 4.17 days
- E = 3.17 days
- F = 2 days
Step 4: Identify Possible Paths
There are two paths in this project:
- Path 1: A [symbol]rarr[/symbol] B [symbol]rarr[/symbol] C [symbol]rarr[/symbol] D [symbol]rarr[/symbol] F
- Path 2: A [symbol]rarr[/symbol] B [symbol]rarr[/symbol] E [symbol]rarr[/symbol] F
Step 5: Determine the Critical Path
Calculate total duration for each path:
- Path 1 = 5 + 6.67 + 8.17 + 4.17 + 2 = 26.01 days
- Path 2 = 5 + 6.67 + 3.17 + 2 = 16.84 days
The critical path is Path 1 because it takes the longest.
When is PERT Useful?
Use PERT in project management when:
1. Project Timelines are Uncertain
If task durations cannot be estimated with high confidence, PERT helps by using multiple time estimates instead of a single guess.
Example: Research projects, product development, innovation initiatives.
2. Tasks Have Complex Dependencies
PERT works well when multiple activities depend on each other, and delays can cascade across the project.
Example: Engineering projects, IT system implementations.
3. You Need to Identify the Critical Path
PERT helps determine the longest sequence of dependent tasks, allowing teams to focus on activities that directly impact the project timeline.
4. Projects Involve Parallel Activities
When some tasks can run simultaneously, PERT helps visualize which ones can proceed independently and which cannot.
5. Risk and Variability Need to be Managed
PERT analysis provides a more realistic timeline by accounting for best-case, most-likely, and worst-case scenarios.
When PERT Is Not the Right Tool
Using PERT in the wrong context adds unnecessary complexity. Avoid PERT when:
1. Tasks are Repetitive and Predictable
If durations are fixed and well-known, a simple Gantt chart is more efficient.
2. Projects are Small or Linear
For straightforward workflows with minimal dependencies, PERT adds no real value.
3. Speed Matters More than Precision
PERT requires estimation and analysis. For fast-moving projects, simpler planning methods may be better.
PERT Chart vs. Gantt Chart
Navigating project management often involves choosing between visualization tools such as PERT charts and Gantt charts. While both serve to streamline project planning, they differ in their visual representations, emphasis on task dependencies, and adaptability to project changes.
The comparison table below outlines the distinctive features of PERT and Gantt charts, helping project managers choose the most suitable tool for their project needs.
| Criteria | PERT Chart | Gantt Chart |
| Visualization | Depicts task dependencies using nodes and arrows | Presents tasks as horizontal bars on a timeline |
| Task Dependencies | Utilizes three-time estimates (O, M, P) for each task to calculate expected time | Typically, it shows only one duration estimate for each task |
| Critical Path | Identifies the critical path, emphasizing tasks crucial for the project duration | Offers less emphasis on identifying the critical path |
| Resource Allocation | Aids in optimizing resource allocation by highlighting critical paths and slack time | Provides a basic overview of task timing, but may not optimize resource allocation as effectively |
| Ease of Understanding | It may be more complex, requiring familiarity with the PERT methodology | Generally, more straightforward and widely understood. |
| Flexibility and Updates | It may be less flexible for dynamic project changes; updates can be time-consuming | More adaptable to changes, allowing easier updates to reflect real-time project status. |
| Project Size | More suitable for large and complex projects with intricate dependencies | Effective for projects of varying sizes, but particularly useful for simpler projects |
| Real-time Tracking | It may require careful manual updating for real-time tracking | Allows for relatively easier real-time tracking and updates |
Conclusion
PERT (Program Evaluation and Review Technique) is a powerful asset in project management, offering a systematic approach to planning, scheduling, and navigating complexity.
Through our exploration, we've uncovered the intricacies of PERT, from its key components, such as nodes and critical paths, to its practical applications for optimizing resource allocation and managing uncertainty.
As a dynamic methodology, PERT empowers project managers to achieve precision in project execution. Embrace the insights shared in this blog to harness the full potential of PERT, ensuring your projects unfold with strategic efficiency and success.
Elevate your project management skills with Invensis Learning's Project Management Certification Courses. Dive deeper into methodologies like PERT, gaining practical insights to enhance your project planning and execution. Enroll today to unlock a world of strategic project management excellence and confidently propel your career forward.


